ADH monitoring metrics
This article describes the monitoring metrics reported by ADH to a Monitoring cluster.
Metric types
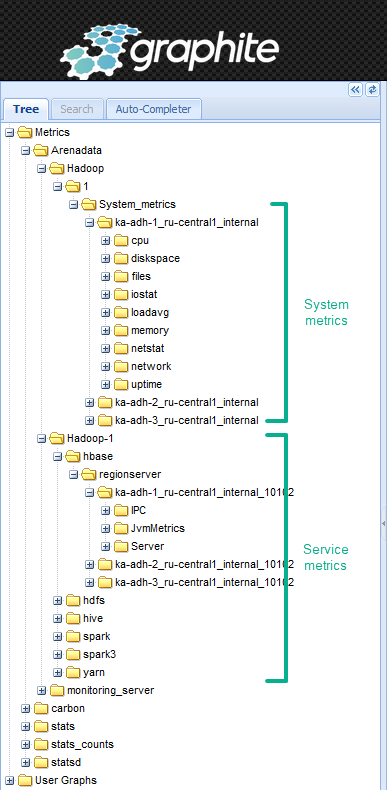
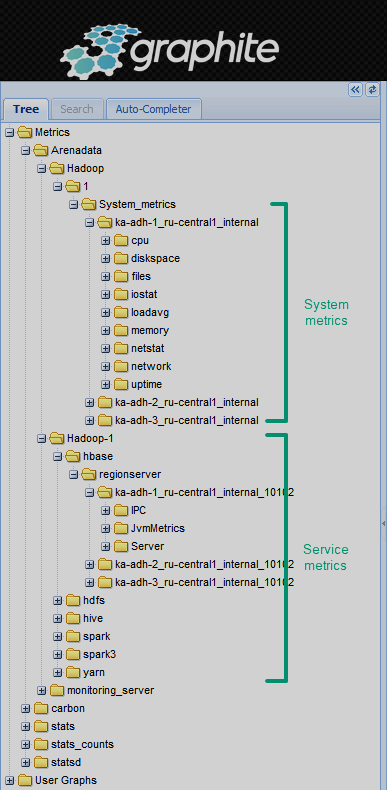
All the metrics are divided into two groups: system metrics and service metrics. Both metric types are available in Graphite/Grafana UIs after the installation of the Monitoring cluster.
System metrics indicate general characteristics of cluster hosts, usually related to resource consumption. The reported system metrics are presented below.
| Metrics group | Description |
|---|---|
cpu |
CPU utilization |
diskspace |
Disk usage |
files |
File statistics |
iostat |
I/O performance |
loadavg |
System load averages |
memory |
Memory usage |
netstat |
Network connection statistics |
network |
Network interface performance |
uptime |
Uptime statistics |
Service metrics reflect the characteristics of individual ADH services and their list is below.
| Component | Metrics group | Metric name | Description |
|---|---|---|---|
RegionServer |
IPC |
numActiveHandler |
The number of RPC handlers that serve incoming requests |
numCallsInGeneralQueue |
The number of user requests in the queue |
||
numOpenConnections |
The number of open connections (RPC) |
||
JvmMetrics |
GcCount |
The total number of GC iterations |
|
GcCountConcurrentMarkSweep |
The number of GC iterations done with the Concurrent Mark Sweep algorithm |
||
GcCountParNew |
The number of GC iterations done with the ParNew algorithm |
||
GcTimeMillis |
The total GC time in milliseconds |
||
GcTimeMillisConcurrentMarkSweep |
The total GC time (CMS) in milliseconds |
||
GcTimeMillisParNew |
The total GC time (ParNew) in milliseconds |
||
MemHeapCommittedM |
The currently allocated heap memory in MB |
||
MemHeapMaxM |
The maximum heap memory in MB |
||
MemHeapUsedM |
The currently utilized heap memory in MB |
||
Server |
Append_95th_percentile |
The 95 percentile latency for the append operation in the RegionServer |
|
Append_median |
The median latency for the append operation in the RegionServer |
||
Delete_95th_percentile |
The 95 percentile latency for the delete operation in the RegionServer |
||
Delete_median |
The median latency for the delete operation in the RegionServer |
||
Get_95th_percentile |
The 95 percentile latency for the get operation in the RegionServer |
||
Get_median |
The median latency for the get operation in the RegionServer |
||
Increment_95th_percentile |
The 95 percentile latency for the increment operation in the RegionServer |
||
Increment_median |
The median latency for the increment operation in the RegionServer |
||
Put_95th_percentile |
The 95 percentile latency for the put operation in the RegionServer |
||
Put_median |
The median latency for the put operation in the RegionServer |
||
ScanTime_95th_percentile |
The 95 percentile latency for the scan operation in the RegionServer |
||
ScanTime_median |
The median latency for the scan operation in the RegionServer |
||
percentFilesLocal |
The percent of store file data that can be read from the local DataNode |
| Component | Metrics group | Metric name | Description |
|---|---|---|---|
datanode |
FSDatasetState |
NumFailedVolumes |
The number of failed disks in a cluster |
JvmMetrics |
GcCount |
The total number of GC iterations |
|
GcCountPSMarkSweep |
The number of GC iterations done with the PS MarkSweep algorithm |
||
GcCountPSScavenge |
The number of GC iterations done with the PS Scavenge algorithm |
||
GcTimeMillis |
The total GC time in milliseconds |
||
GcTimeMillisPSMarkSweep |
The total GC time (PS MarkSweep) in milliseconds |
||
GcTimeMillisPSScavenge |
The total GC time (PS Scavenge) in milliseconds |
||
MemHeapCommittedM |
The currently allocated heap memory in MB |
||
MemHeapMaxM |
The maximum heap memory in MB |
||
MemHeapUsedM |
The currently utilized heap memory in MB |
||
RpcActivityForPort |
NumOpenConnections |
The number of open RPC connections |
|
RpcProcessingTimeAvgTime |
The average request processing time |
||
RpcQueueTimeAvgTime |
The average time of pending requests in a queue |
||
namenode |
FSNamesystem |
BlockCapacity |
The total space available for storing data blocks |
BlocksTotal |
The total number of data blocks |
||
CapacityTotal |
The total space available for storing data |
||
CapacityUsed |
The total capacity used for storing data |
||
CorruptReplicatedBlocks |
The number of blocks that are corrupted or have been copied repeatedly to HDFS |
||
FilesTotal |
The total number of files in HDFS |
||
MissingBlocks |
The number of missing data blocks |
||
UnderReplicatedBlocks |
The number of data blocks that do not have sufficient replicas in HDFS |
||
JvmMetrics |
GcCount |
The total number of GC iterations |
|
GcCountPSMarkSweep |
The number of GC iterations done with the PS MarkSweep algorithm |
||
GcCountPSScavenge |
The number of GC iterations done with the PS Scavenge algorithm |
||
GcTimeMillis |
The total GC time in milliseconds |
||
GcTimeMillisPSMarkSweep |
The total GC time (PS MarkSweep) in milliseconds |
||
GcTimeMillisPSScavenge |
The total GC time (PS Scavenge) in milliseconds |
||
MemHeapCommittedM |
The currently allocated heap memory in MB |
||
MemHeapMaxM |
The maximum heap memory in MB |
||
MemHeapUsedM |
The currently utilized heap memory in MB |
||
RpcActivityForPort |
NumOpenConnections |
The number of open RPC connections |
|
RpcProcessingTimeAvgTime |
The average request processing time |
||
RpcQueueTimeAvgTime |
The average time of pending requests in a queue |
| Component | Metrics group | Metric name | Description |
|---|---|---|---|
hiveserver2 |
ClassLoading |
LoadedClassCount |
The number of loaded classes |
GarbageCollector |
PSMarkSweep |
The GC time spent using the PS MarkSweep algorithm |
|
PSScavenge |
The GC time spent using the PS Scavenge algorithm |
||
HS2 |
active_calls_api_Driver_execute |
The |
|
active_calls_api_Driver_run |
|||
active_calls_api_PostHook_org_apache_hadoop_hive_ql_stats_OperatorStatsReaderHook |
|||
active_calls_api_compile |
|||
active_calls_api_hs2_operation_INITIALIZED |
The number of active operations in HiveServer2 (HS2) with the corresponding status |
||
active_calls_api_hs2_operation_PENDING |
|||
active_calls_api_hs2_operation_RUNNING |
|||
active_calls_api_hs2_sql_operation_PENDING |
The number of active SQL operations with the corresponding status |
||
active_calls_api_hs2_sql_operation_RUNNING |
|||
active_calls_api_parse |
The number of requests submitted to the HiveServer via the API, which were successfully parsed and ready for processing |
||
active_calls_api_releaseLocks |
The |
||
active_calls_api_runTasks |
|||
active_calls_api_semanticAnalyze |
|||
active_calls_api_waitCompile |
|||
active_calls_hs2_compiling_queries |
The number of requests that are currently compiling |
||
active_calls_hs2_executing_queries |
The number of requests that are currently executing |
||
active_calls_hs2_submitted_queries |
The number of requests submitted for execution |
||
api_Driver_execute |
The |
||
api_Driver_run |
|||
api_PostHook_org_apache_hadoop_hive_ql_stats_OperatorStatsReaderHook |
|||
api_compile |
|||
api_hs2_operation_INITIALIZED |
|||
api_hs2_operation_PENDING |
|||
api_hs2_operation_RUNNING |
|||
api_hs2_sql_operation_PENDING |
|||
api_hs2_sql_operation_RUNNING |
|||
api_parse |
|||
api_releaseLocks |
|||
api_runTasks |
|||
api_semanticAnalyze |
|||
api_waitCompile |
|||
cumulative_connection_count |
The total number of established connections to HiveServer2 since the server startup |
||
exec_async_pool_size |
The current size of the HiveServer2 asynchronous thread pool |
||
exec_async_queue_size |
The current size of the HiveServer2 asynchronous operation queue |
||
hs2_active_sessions |
The number of active sessions on HiveServer2 |
||
hs2_compiling_queries |
The number of queries being compiled on HiveServer2 |
||
hs2_completed_operation_CLOSED |
The number of completed operations with the corresponding status |
||
hs2_completed_operation_FINISHED |
|||
hs2_completed_sql_operation_CLOSED |
The number of completed SQL operations with the corresponding status |
||
hs2_completed_sql_operation_FINISHED |
|||
hs2_executing_queries |
The number of queries being executed on HiveServer2 |
||
hs2_open_sessions |
The number of open sessions on HiveServer2 |
||
hs2_sql_operation_active_user |
The current number of active users performing SQL operations on HiveServer2 |
||
hs2_submitted_queries |
The number of queries submitted to HiveServer2 |
||
hs2_succeeded_queries |
The number of queries succeeded on HiveServer2 |
||
buffers_direct_count |
JVM metrics |
||
buffers_direct_used |
|||
buffers_mapped_capacity |
|||
buffers_mapped_count |
|||
buffers_mapped_used |
|||
classLoading_loaded |
|||
classLoading_unloaded |
|||
gc_PS-MarkSweep_count |
|||
gc_PS-MarkSweep_time |
|||
gc_PS-Scavenge_count |
|||
gc_PS-Scavenge_time |
|||
jvm_pause_extraSleepTime |
|||
memory_heap_committed |
|||
memory_heap_init |
|||
memory_heap_max |
|||
memory_heap_usage |
|||
memory_heap_used |
|||
memory_non-heap_committed |
|||
memory_non-heap_init |
|||
memory_non-heap_max |
|||
memory_non-heap_usage |
|||
memory_non-heap_used |
|||
memory_pools_Code-Cache_usage |
|||
memory_pools_Compressed-Class-Space_usage |
|||
memory_pools_Metaspace_usage |
|||
memory_pools_PS-Eden-Space_usage |
|||
memory_pools_PS-Old-Gen_usage |
|||
memory_pools_PS-Survivor-Space_usage |
|||
memory_total_committed |
|||
memory_total_init |
|||
memory_total_max |
|||
memory_total_used |
|||
open_connections |
|||
open_operations |
|||
qc_current_size |
|||
qc_max_size |
|||
threads_blocked_count |
|||
threads_count |
|||
threads_daemon_count |
|||
threads_deadlock_count |
|||
threads_new_count |
|||
threads_runnable_count |
|||
threads_terminated_count |
|||
threads_timed_waiting_count |
|||
threads_waiting_count |
|||
waiting_compile_ops |
|||
Memory |
HeapMemoryUsage_committed |
The amount of memory allocated for heap |
|
HeapMemoryUsage_init |
The initial heap memory size |
||
HeapMemoryUsage_max |
The maximum heap memory size |
||
HeapMemoryUsage_used |
The utilized heap memory size |
||
NonHeapMemoryUsage_committed |
The amount of memory allocated for non-heap JVM areas |
||
NonHeapMemoryUsage_init |
The initial memory size allocated for non-heap JVM areas |
||
NonHeapMemoryUsage_max |
The maximum memory size allocated for non-heap JVM areas |
||
NonHeapMemoryUsage_used |
The utilized memory for non-heap JVM areas |
||
MemoryPool |
CodeCache |
The code cache size |
|
CompressedClassSpace |
The size of the compressed class space |
||
Metaspace |
The metaspace size |
||
PSEdenSpace |
The size of the Eden space in the Spark History Server using the PS algorithm |
||
PSOldGen |
The size of the Old Generation space in the Spark History Server using the PS algorithm |
||
PSSurvivorSpace |
The size of the Survivor space in the Spark History Server using the PS algorithm |
||
OperatingSystem |
ProcessCpuLoad |
The CPU load |
|
Threading |
DaemonThreadCount |
The number of daemon threads |
|
PeakThreadCount |
The maximum number of threads |
||
ThreadCount |
The current number of threads |
||
TotalStartedThreadCount |
The total threads count |
||
metastore |
ClassLoading |
LoadedClassCount |
The number of loaded classes |
GarbageCollector |
PSMarkSweep |
The GC time spent using the PS MarkSweep algorithm |
|
PSScavenge |
The GC time spent using the PS Scavenge algorithm |
||
Memory |
HeapMemoryUsage_committed |
The amount of memory allocated for heap |
|
HeapMemoryUsage_init |
The initial heap memory size |
||
HeapMemoryUsage_max |
The maximum heap memory size |
||
HeapMemoryUsage_used |
The utilized heap memory size |
||
NonHeapMemoryUsage_committed |
The amount of memory allocated for non-heap JVM areas |
||
NonHeapMemoryUsage_init |
The initial memory size allocated for non-heap JVM areas |
||
NonHeapMemoryUsage_max |
The maximum memory size allocated for non-heap JVM areas |
||
NonHeapMemoryUsage_used |
The utilized memory for non-heap JVM areas |
||
MemoryPool |
CodeCache |
The code cache size |
|
CompressedClassSpace |
The size of the compressed class space |
||
Metaspace |
The metaspace size |
||
PSEdenSpace |
The size of the Eden space in the Spark History Server using the PS algorithm |
||
PSOldGen |
The size of the Old Generation space in the Spark History Server using the PS algorithm |
||
PSSurvivorSpace |
The size of the Survivor space in the Spark History Server using the PS algorithm |
||
OperatingSystem |
ProcessCpuLoad |
The CPU load |
|
Threading |
DaemonThreadCount |
The number of daemon threads |
|
PeakThreadCount |
The maximum number of threads |
||
ThreadCount |
The current number of threads |
||
TotalStartedThreadCount |
The total threads count |
||
metastore |
PS-MarkSweep_count |
The number of GC iterations done using the Concurrent Mark Sweep algorithm |
|
PS-MarkSweep_time |
The total GC time elapsed using the PS MarkSweep algorithm |
||
PS-Scavenge_count |
The number of GC iterations done using the PS Scavenge algorithm |
||
PS-Scavenge_time |
The total GC time elapsed using the PS Scavenge algorithm |
||
active_calls_create_table |
The |
||
active_calls_drop_table |
|||
active_calls_get_all_functions |
|||
active_calls_get_config_value |
|||
active_calls_get_database |
|||
active_calls_get_databases |
|||
active_calls_get_functions |
|||
active_calls_get_multi_table |
|||
active_calls_get_table |
|||
active_calls_get_tables |
|||
active_calls_get_tables_by_type |
|||
api_create_table |
The |
||
api_create_table_with_environment_context |
|||
api_drop_table |
|||
api_drop_table_with_environment_context |
|||
api_flushCache |
|||
api_get_all_databases |
|||
api_get_all_functions |
|||
api_get_config_value |
|||
api_get_current_notificationEventId |
|||
api_get_database |
|||
api_get_databases |
|||
api_get_functions |
|||
api_get_multi_table |
|||
api_get_next_notification |
|||
api_get_table |
|||
api_get_table_objects_by_name_req |
|||
api_get_table_req |
|||
api_get_tables |
|||
api_get_tables_by_type |
|||
api_init |
|||
api_set_ugi |
|||
api_shutdown |
|||
blocked_count |
The number of threads blocked |
||
create_total_count_dbs |
The number of databases created |
||
create_total_count_partitions |
The number of partitions created |
||
create_total_count_tables |
The number of tables created |
||
daemon_count |
The daemon count |
||
deadlock_count |
The number of deadlocks detected |
||
delete_total_count_dbs |
The total number of deleted databases |
||
delete_total_count_partitions |
The total number of deleted partitions |
||
delete_total_count_tables |
The total number of deleted tables |
||
direct_count |
JVM metrics |
||
direct_used |
|||
directsql_errors |
|||
heap_committed |
|||
heap_init |
|||
heap_max |
|||
heap_usage |
|||
heap_used |
|||
jvm_pause_extraSleepTime |
|||
jvm_pause_info-threshold |
|||
jvm_pause_warn-threshold |
|||
loaded |
|||
mapped_capacity |
|||
mapped_count |
|||
mapped_used |
|||
new_count |
|||
non-heap_committed |
|||
non-heap_init |
|||
non-heap_max |
|||
non-heap_usage |
|||
non-heap_used |
|||
open_connections |
|||
pools_Code-Cache_usage |
|||
pools_Compressed-Class-Space_usage |
|||
pools_Metaspace_usage |
|||
pools_PS-Eden-Space_usage |
|||
pools_PS-Old-Gen_usage |
|||
pools_PS-Survivor-Space_usage |
|||
runnable_count |
|||
terminated_count |
|||
timed_waiting_count |
|||
total_committed |
|||
total_count_dbs |
|||
total_count_partitions |
|||
total_count_tables |
|||
total_init |
|||
total_max |
|||
total_used |
|||
unloaded |
|||
waiting_count |
| Component | Metrics group | Metric name | Description |
|---|---|---|---|
historyserver |
ClassLoading |
LoadedClassCount |
The number of loaded classes |
GarbageCollector |
PSMarkSweep |
The GC time spent using the PS MarkSweep algorithm |
|
PSScavenge |
The GC time spent using the PS Scavenge algorithm |
||
Memory |
HeapMemoryUsage_committed |
The amount of memory allocated for heap |
|
HeapMemoryUsage_init |
The initial heap memory size |
||
HeapMemoryUsage_max |
The maximum heap memory size |
||
HeapMemoryUsage_used |
The utilized heap memory size |
||
NonHeapMemoryUsage_committed |
The amount of memory allocated for non-heap JVM areas |
||
NonHeapMemoryUsage_init |
The initial memory size allocated for non-heap JVM areas |
||
NonHeapMemoryUsage_max |
The maximum memory size allocated for non-heap JVM areas |
||
NonHeapMemoryUsage_used |
The utilized memory for non-heap JVM areas |
||
MemoryPool |
CodeCache |
The code cache size |
|
CompressedClassSpace |
The size of the compressed class space |
||
Metaspace |
The metaspace size |
||
PSEdenSpace |
The size of the Eden space in the Spark History Server using the PS algorithm |
||
PSOldGen |
The size of the Old Generation space in the Spark History Server using the PS algorithm |
||
PSSurvivorSpace |
The size of the Survivor space in the Spark History Server using the PS algorithm |
||
OperatingSystem |
ProcessCpuLoad |
The CPU load |
|
Threading |
DaemonThreadCount |
The number of daemon threads |
|
PeakThreadCount |
The maximum number of threads |
||
ThreadCount |
The current number of threads |
||
TotalStartedThreadCount |
The total threads count |
| Component | Metrics group | Metric name | Description |
|---|---|---|---|
historyserver |
JvmMetrics |
GcCount |
The total number of GC iterations |
GcCountPSMarkSweep |
The number of GC iterations done with the PS MarkSweep algorithm |
||
GcCountPSScavenge |
The number of GC iterations done with the PS Scavenge algorithm |
||
GcTimeMillis |
The total GC time in milliseconds |
||
GcTimeMillisPSMarkSweep |
The total GC time (PS MarkSweep) in milliseconds |
||
GcTimeMillisPSScavenge |
The total GC time (PS Scavenge) in milliseconds |
||
MemHeapCommittedM |
The currently allocated heap memory in MB |
||
MemHeapMaxM |
The maximum heap memory in MB |
||
MemHeapUsedM |
The currently utilized heap memory in MB |
||
nodemanager |
JvmMetrics |
GcCount |
The total number of GC iterations |
GcCountPSMarkSweep |
The number of GC iterations done with the PS MarkSweep algorithm |
||
GcCountPSScavenge |
The number of GC iterations done with the PS Scavenge algorithm |
||
GcTimeMillis |
The total GC time in milliseconds |
||
GcTimeMillisPSMarkSweep |
The total GC time (PS MarkSweep) in milliseconds |
||
GcTimeMillisPSScavenge |
The total GC time (PS Scavenge) in milliseconds |
||
MemHeapCommittedM |
The currently allocated heap memory in MB |
||
MemHeapMaxM |
The maximum heap memory in MB |
||
MemHeapUsedM |
The currently utilized heap memory in MB |
||
NodeManagerMetrics |
AllocatedContainers |
The number of allocated containers |
|
AllocatedGB |
The size of allocated memory in GB |
||
AllocatedVCores |
The number of allocated cores |
||
AvailableGB |
The size of available memory in GB |
||
AvailableVCores |
The number of available cores |
||
BadLocalDirs |
The number of directories available on the local disk that can be used for storing task data due to errors |
||
BadLogDirs |
The number of directories on the local disk that can not be used for storing task log files due to errors |
||
ContainerLaunchDurationAvgTime |
The average time spent on launching a task container |
||
ContainersCompleted |
The number of task containers that were completed successfully |
||
ContainersFailed |
The number of task containers that failed to complete |
||
ContainersIniting |
The number of task containers in the initialization state |
||
ContainersKilled |
The number of task containers that were forcibly stopped |
||
ContainersLaunched |
The number of task containers that were started successfully |
||
ContainersRunning |
The number of task containers that are currently running |
||
GoodLocalDirsDiskUtilizationPerc |
The percentage of disk space utilization in directories on a local disk that can be used for storing task data |
||
GoodLogDirsDiskUtilizationPerc |
The percentage of disk space utilization in directories on a local disk that can be used for storing task log files |
||
resourcemanager |
JvmMetrics |
GcCount |
The total number of GC iterations |
GcCountPSMarkSweep |
The number of GC iterations done with the PS MarkSweep algorithm |
||
GcCountPSScavenge |
The number of GC iterations done with the PS Scavenge algorithm |
||
GcTimeMillis |
The total GC time in milliseconds |
||
GcTimeMillisPSMarkSweep |
The total GC time (PS MarkSweep) in milliseconds |
||
GcTimeMillisPSScavenge |
The total GC time (PS Scavenge) in milliseconds |
||
MemHeapCommittedM |
The currently allocated heap memory in MB |
||
MemHeapMaxM |
The maximum heap memory in MB |
||
MemHeapUsedM |
The currently utilized heap memory in MB |
||
QueueMetrics |
AllocatedVCores |
The number of allocated cores |
|
AppsFailed |
The number of applications exited with an error |
||
AppsKilled |
The number of applications killed by a user |
||
AppsPending |
The number of applications pending for resources |
||
AppsRunning |
The number of started applications |
||
AppsSubmitted |
The number of applications submitted to a queue |
||
AvailableVCores |
The number of available cores |
Metrics visualization
To visualize monitoring metrics as graphs and charts, use the Graphite and Grafana UIs available after the installation of a monitoring cluster.
Graphite
Graphite is a monitoring tool that stores numeric time-series data and visualizes this data on graphs in web UI.
To view metrics in Graphite, enter the address of the host, where your monitoring cluster is installed, into the browser address bar. For example, http://10.20.30.444:<port>. By default, Graphite runs on the 80 port, so you can omit the port number unless you specified a different port during the installation of your monitoring cluster.
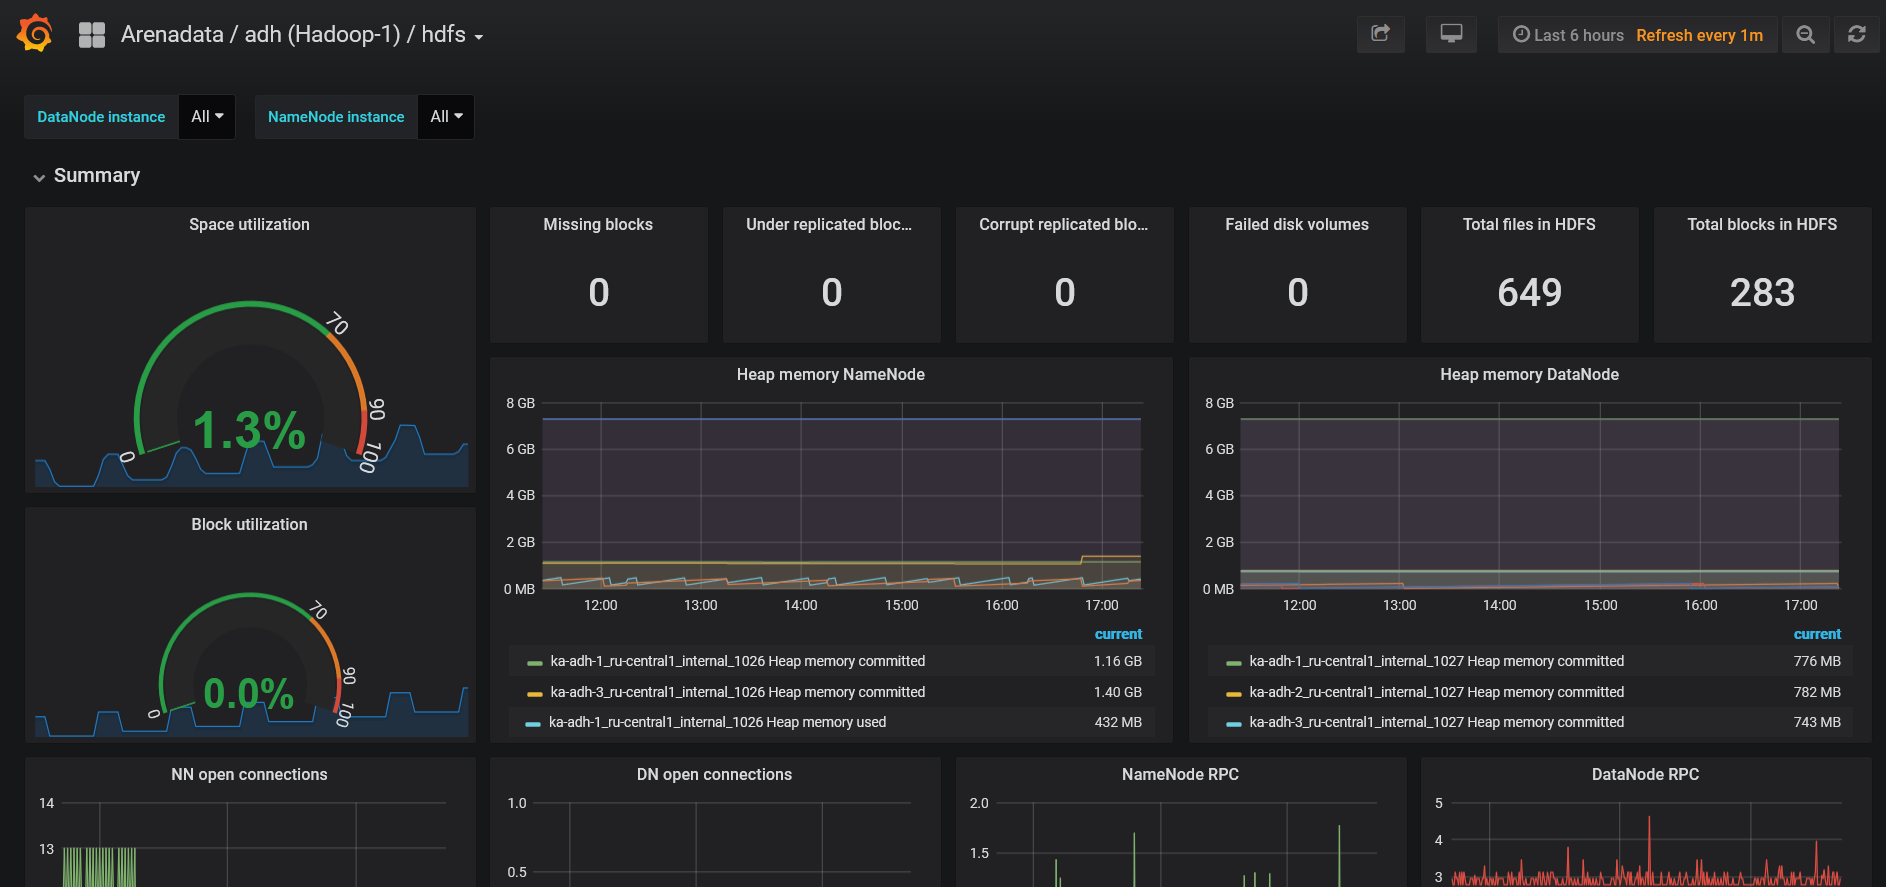
Grafana
Grafana allows you to query data and visualize metrics stored in Graphite.
To view the Grafana web UI, enter the address of the host, where your monitoring cluster is installed, into the browser address bar. For example, http://10.20.30.444:<port>. By default, Grafana UI is available on the 3000 port.
On the Grafana home page, click Home, and then select the required dashboard to view the metrics.