

HBase UI overview
HBase web-based user interfaces allow you to view the current cluster state and change log level without service restart. HBase UI is supported for the Master, Region, and Thrift2 servers. URLs of HBase user interfaces are listed in the table below.
| Server | Address |
|---|---|
Master Server |
http://<Master Server IP>:16010 |
Region Server |
http://<Region Server IP>:16030 |
HBase Thrift2 Server |
http://<HBase Thrift2 Server IP>:9095 |
Master Server UI
HBase Master Server UI works on the 16010 port.
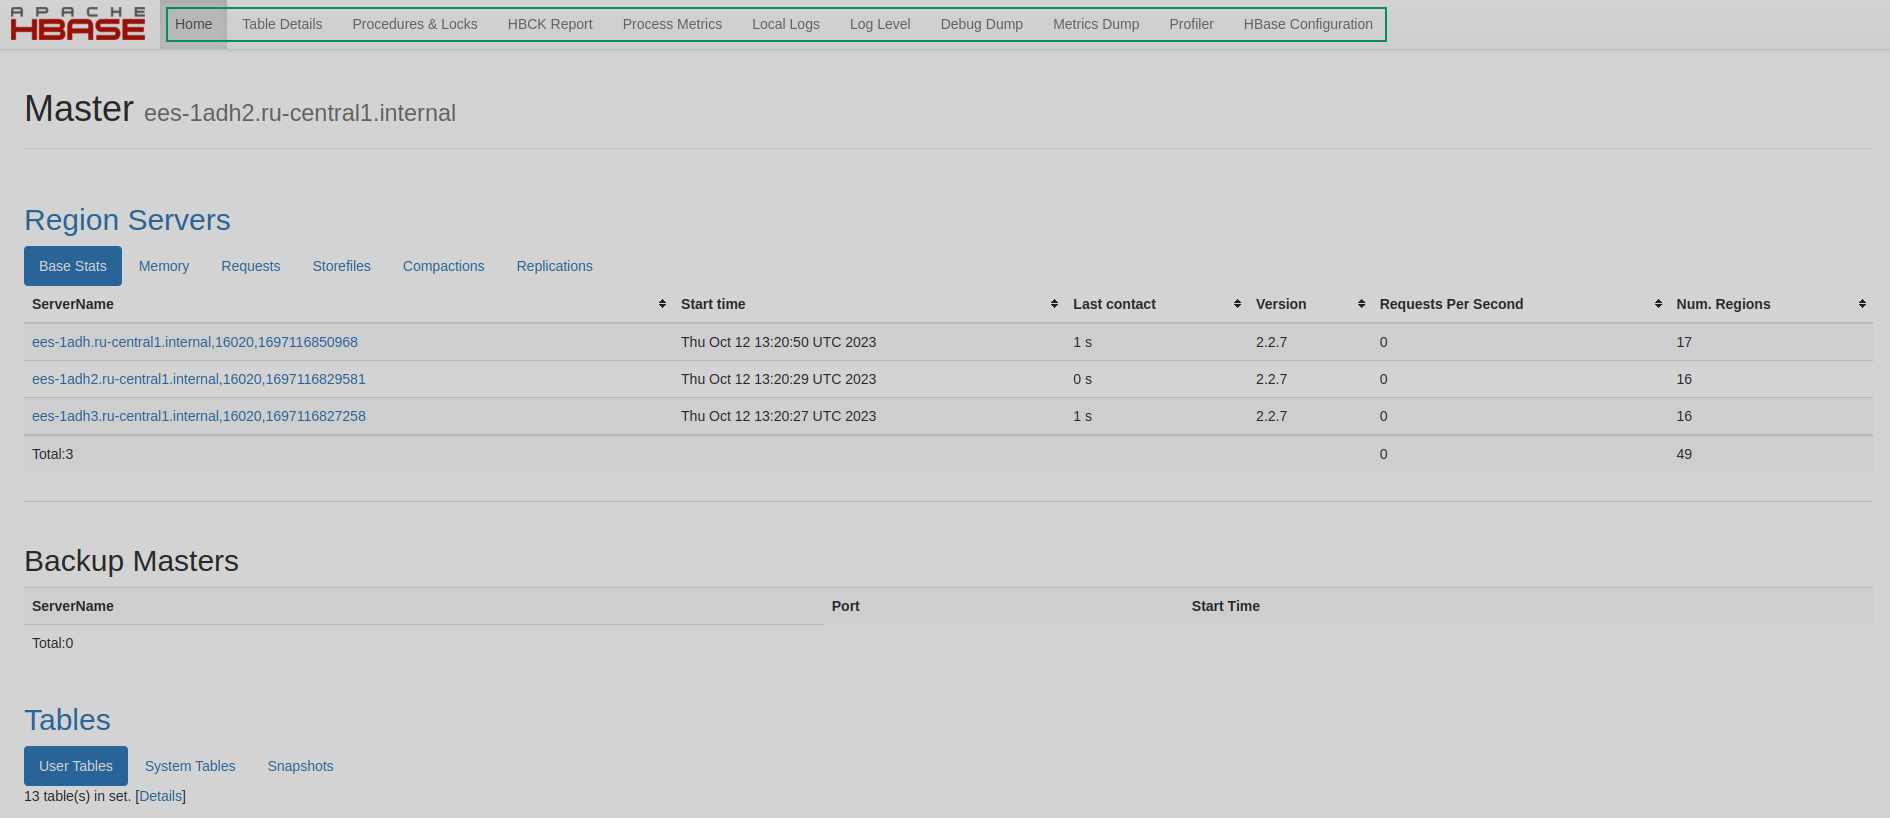
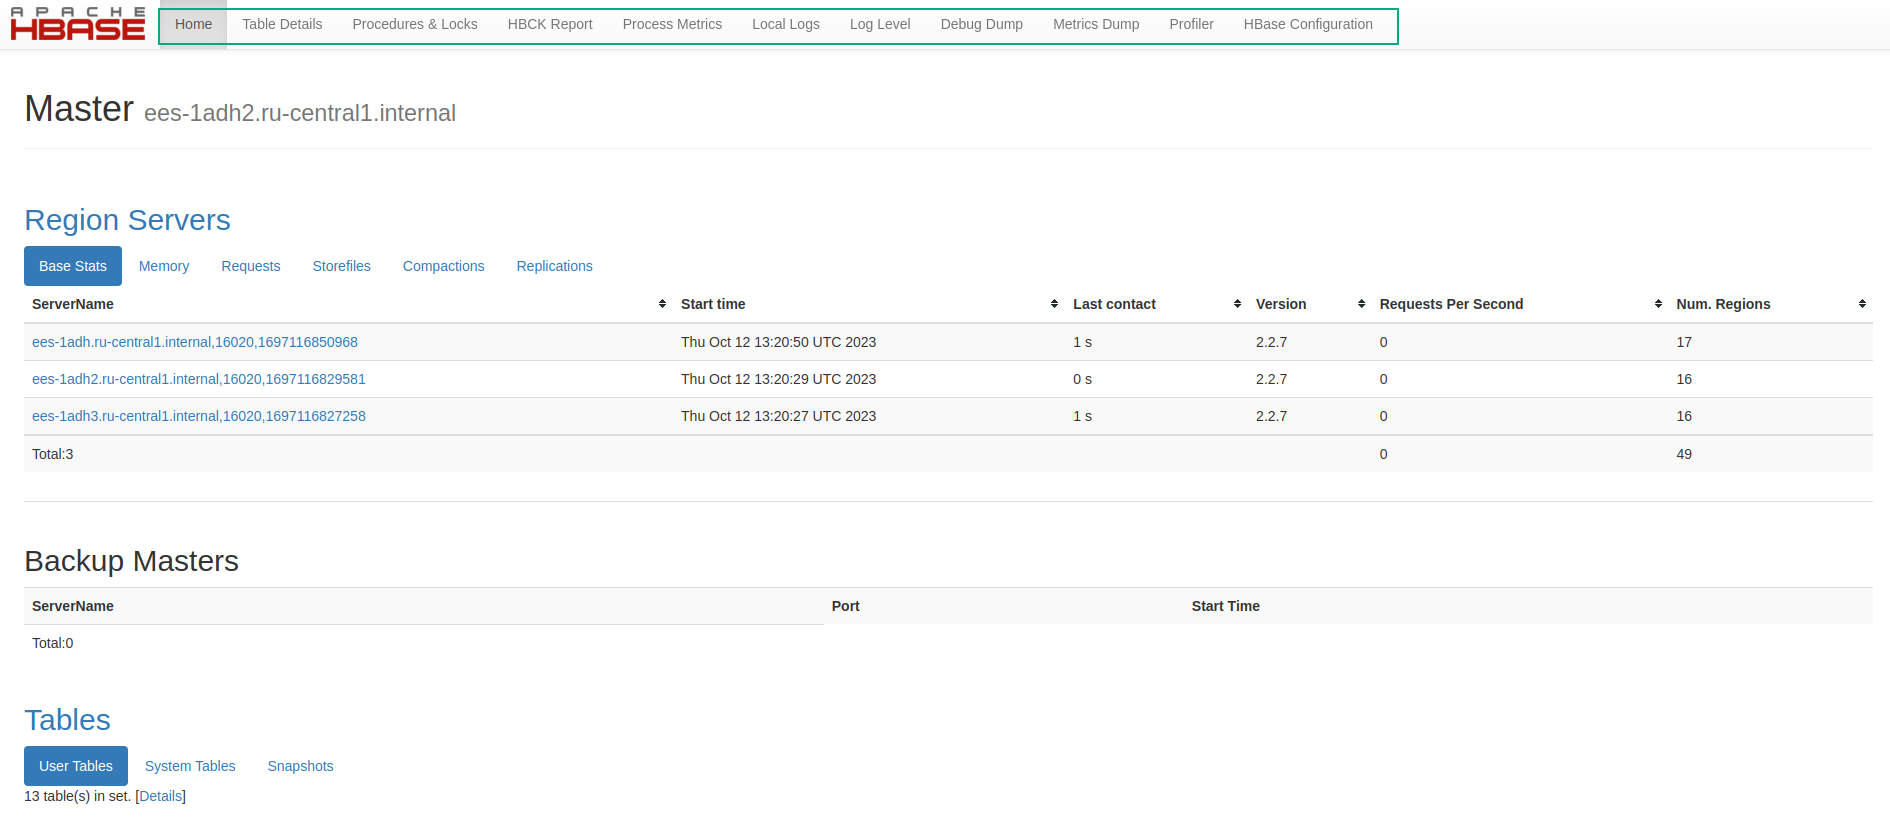
HBase Master UI contains the following tabs:
Home
The Home tab of the HBase Master Server UI includes the following sections with general information about an HBase cluster:
-
Region Servers — contains base statistics, information about used memory, including memstore size, replication, and storefile statistics. The metric table contains links that refer to related HBase UIs of Region Servers.
-
Backup Masters — provides information about Backup Master Servers if there are any in the cluster.
-
Tables — lists user and system tables and snapshots.
-
Peers — contains information on remote slave clusters where data is replicated to.
-
Tasks — displays information on processed tasks. You can review non-RPC and RPC handler tasks separately. Also, the View as JSON link allows you to get task statistics in the JSON format.
-
Software Attributes — contains general information on JVM, HBase, Hadoop, and ZooKeeper. It includes versions, checksums, dates of compilation, addresses of all registered ZK servers, the root node of this cluster in ZK, the key to adding the cluster as a peer for replication, the location of HBase home directory, and others.
Table Details
The Table Details tab contains the User Tables table with two columns:
-
Table — displays links to a page with detailed table information that includes table attributes, schema, regions, region distribution by Region Servers, and table statistics.
-
Description — contains table descriptions similar to the describe command output.
Procedures & Locks
The Procedures & Locks tab lists procedures that are completed with errors and locks. It also contains procedure WAL state statistics.
HBCK Report
The HBCK Report tab displays two reports: HBCK Chore Report and CatalogJanitor Consistency Issues.
HBCK Chore Report checks the consistency of region information in the HMaster memory, RegionServer memory, and HDFS. It also checks whether the region exists and whether the deployment information of the region is consistent.
CatalogJanitor Consistency Issues Report determines whether the region information in the meta table is complete and whether there are overlap and hole issues.
Run the hbck_chore_run and catalogjanitor_run commands in hbase shell to generate new reports. Only report titles are shown if there are no problems to display.
Process Metrics
The Process Metrics tab displays a metric list for the HMaster process that includes the following items:
-
Threads — statistics on process threads.
-
GC Collectors — statistics on Java garbage collectors.
-
Metaspace — statistics on
Metaspace. TheMetaspaceregion holds memory for your live class metadata and classloaders. -
Compressed Class Space — statistics on
Compressed Class Spacethat is the region of compressed pointers used to store information about loaded classes. -
Par Eden Space — statistics on
Eden Spacewhere the most new Java objects are created. When the memory space for this region is filled up, reachable objects fromEden Spaceare moved toSurvivor Space. -
Par Survivor Space — statistics on
Survivor Space. When the memory space for this region is filled up, reachable objects fromSurvivor Spaceare moved toCMS Old Gen. -
CMS Old Gen — statistics on the
CMS Old Genmemory region. This heap area is used for permanent objects.
Local Logs
The Local Logs tab contains a list of links to log files stored on the current host. When you click a link, the related log file opens in the browser window. In the file system, the log files are stored in the /var/log/hbase directory. For more information, see Logging in HBase.
Log Level
The Log Level tab allows you to change the log level without service restart. The log level set on this tab is applied until the service is restarted. After restart, settings from the log4j.properties file are used.
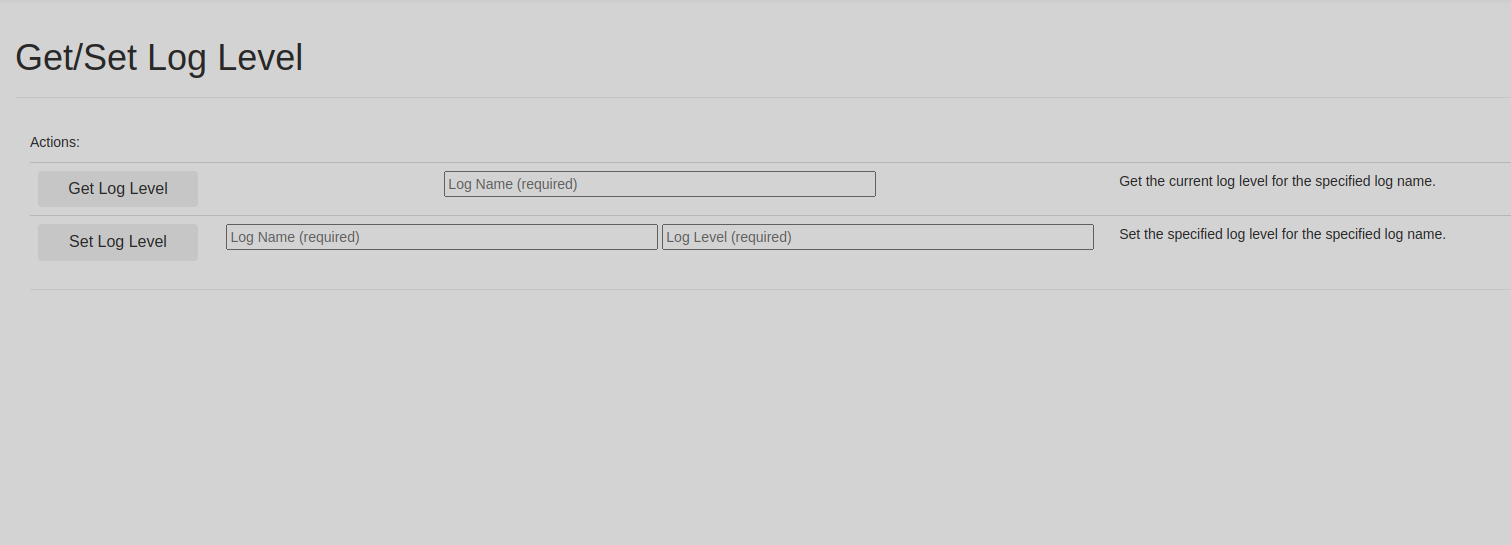
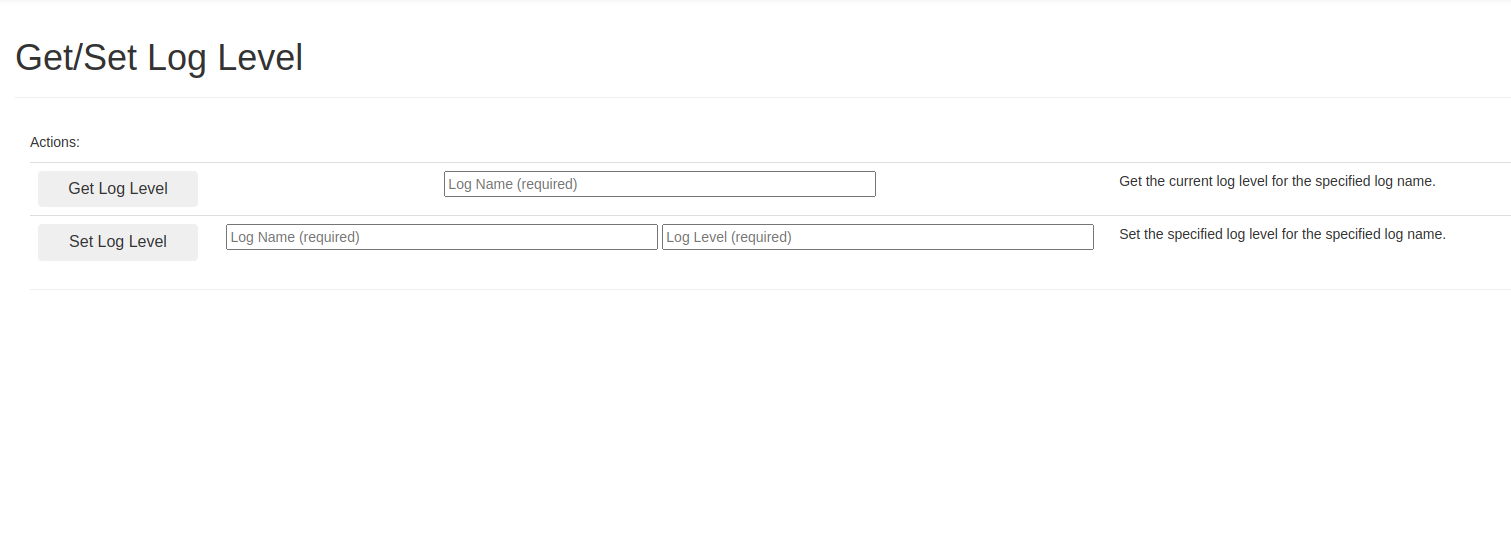
To check the log level, fill in the first Log Name field and click Get Log Level. The log name should contain class hierarchy, for example, org.apache.hadoop.hbase.
To change the log level, type a log name in the corresponding field. Fill in the Log Level field with one of the following values: TRACE, DEBUG, or INFO and click Set Log Level.
Debug Dump
The Debug Dump tab displays a report of the current state of the Master Server. It contains information on version, tasks, executors, the process thread dump, the server configuration in the XML format and logs. In case of problems in the HBase cluster, the debug dump can be used as a start point of debugging.
Metrics Dump
The Metrics Dump tab displays a report with metrics of the Master Server. It is the dump of the JMX bean in the JSON format.
Region Server UI
HBase Region Server UI works on the 16030 port.
HBase Region Server UI contains the following tabs:
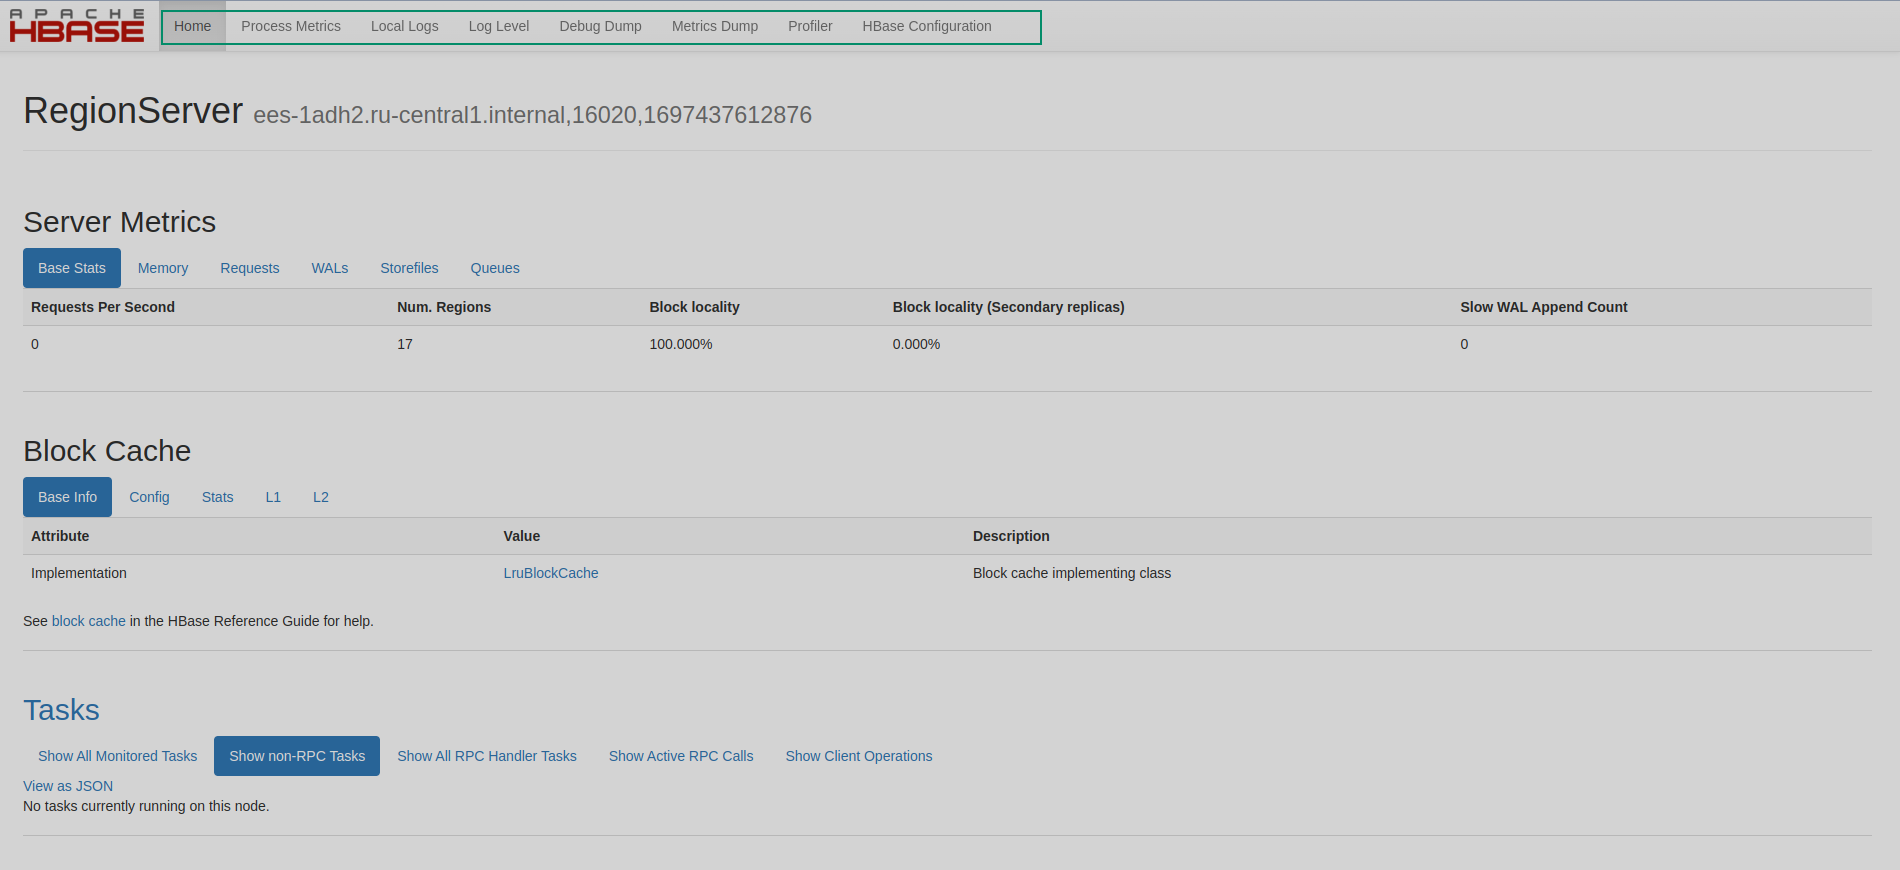
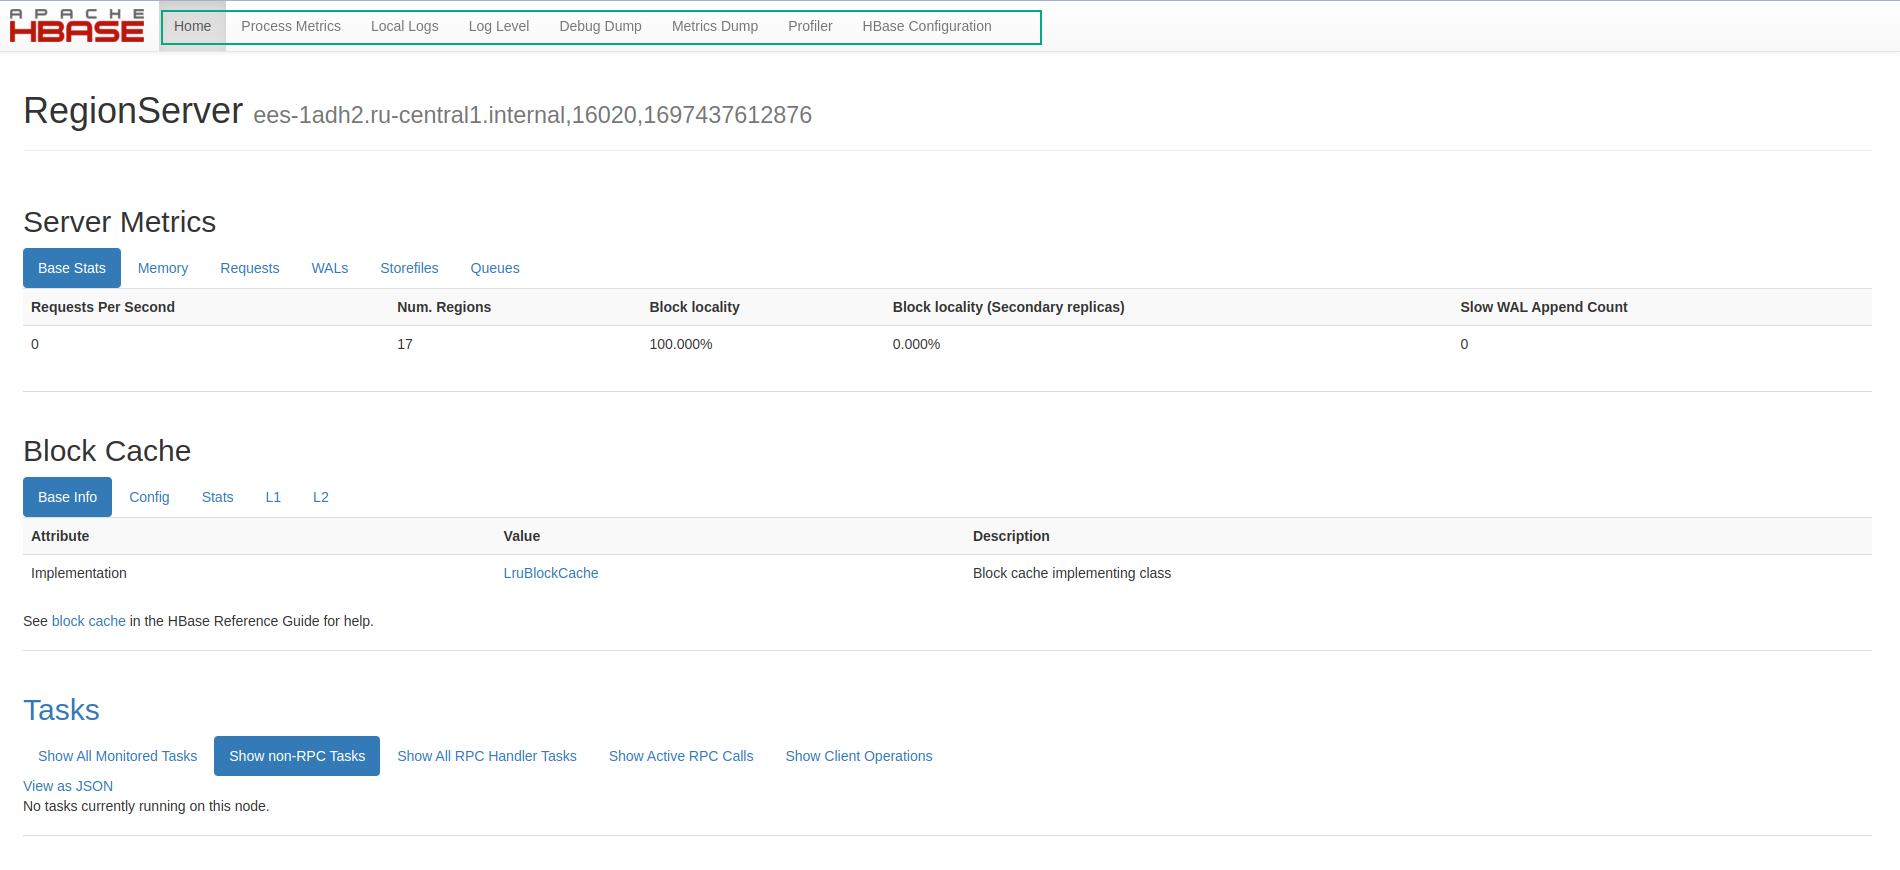
Home
The Home tab of the HBase Region Server UI includes general information about the Region Server:
-
Server Metrics — contains base statistics for the current server, information about used memory including memstore size, statistics on requests, WAL, storefiles, and lengths of different types of queues.
-
Block Cache — includes information on block cache statistics and configuration.
-
Tasks — displays information on processed tasks. You can review non-RPC and RPC handler tasks separately. Also, the View as JSON link allows you to get task statistics in the JSON format.
-
Regions — contains metrics for each region including statistics on requests, storefiles, compaction, and memstore size. A region name consists of a table name, a start key, and a randomly generated region id separated by commas. For example:
SYSTEM.LOG,\x01\x00\x00\x00,1695113080532.c4e4b11c5617462e641c9db3538a9c7d.,people_ages,F,1694507451861.b53a2f6692e0d4ab5a46a4def96676b0. -
Replication Status — displays replication information and metrics if the replication is configured in the cluster.
-
Software Attributes — contains general information on JVM, HBase, Hadoop, and ZooKeeper. It includes versions, checksums, dates of compilation, addresses of all registered ZK servers, address of HBase Master, and others.
Process Metrics
The Process Metrics tab displays a metric list for the HRegionServer process that includes the following items:
-
Threads — statistics on process threads.
-
GC Collectors — statistics on Java garbage collectors.
-
Metaspace — statistics on
Metaspace. TheMetaspaceregion holds memory for your live class metadata and classloaders. -
Compressed Class Space — statistics on
Compressed Class Spacethat is the region of compressed pointers used to store information about loaded classes. -
Par Eden Space — statistics on
Eden Spacewhere the most new Java objects are created. When the memory space for this region is filled up, reachable objects fromEden Spaceare moved toSurvivor Space. -
Par Survivor Space — statistics on
Survivor Space. When the memory space for this region is filled up, reachable objects fromSurvivor Spaceare moved toCMS Old Gen. -
CMS Old Gen — statistics on the
CMS Old Genmemory region. This heap area is used for permanent objects.
Local Logs
The Local Logs tab contains a list of links to log files stored on the current host. When you click a link, the related log file opens in the browser window. In the file system, the log files are stored in the /var/log/hbase directory. For more information, see Logging in HBase.
Log Level
The Log Level tab allows you to change the log level without service restart. The log level set on this tab is applied until the service is restarted. After restart, settings from the log4j.properties file are used.
To check the log level, fill in the first Log Name field and click Get Log Level. The log name should contain class hierarchy, for example, org.apache.hadoop.hbase.
To change the log level, type a log name in the corresponding field. Fill in the Log Level field with one of the following values: TRACE, DEBUG, or INFO and click Set Log Level.
Metrics Dump
The Metrics Dump tab displays a report with metrics of the Region Server. It is the dump of the JMX bean in the JSON format.
Thrift2 Server UI
HBase Thrift2 Server UI listens on the 9095 port.
HBase Thrift2 Server UI contains the following tabs:
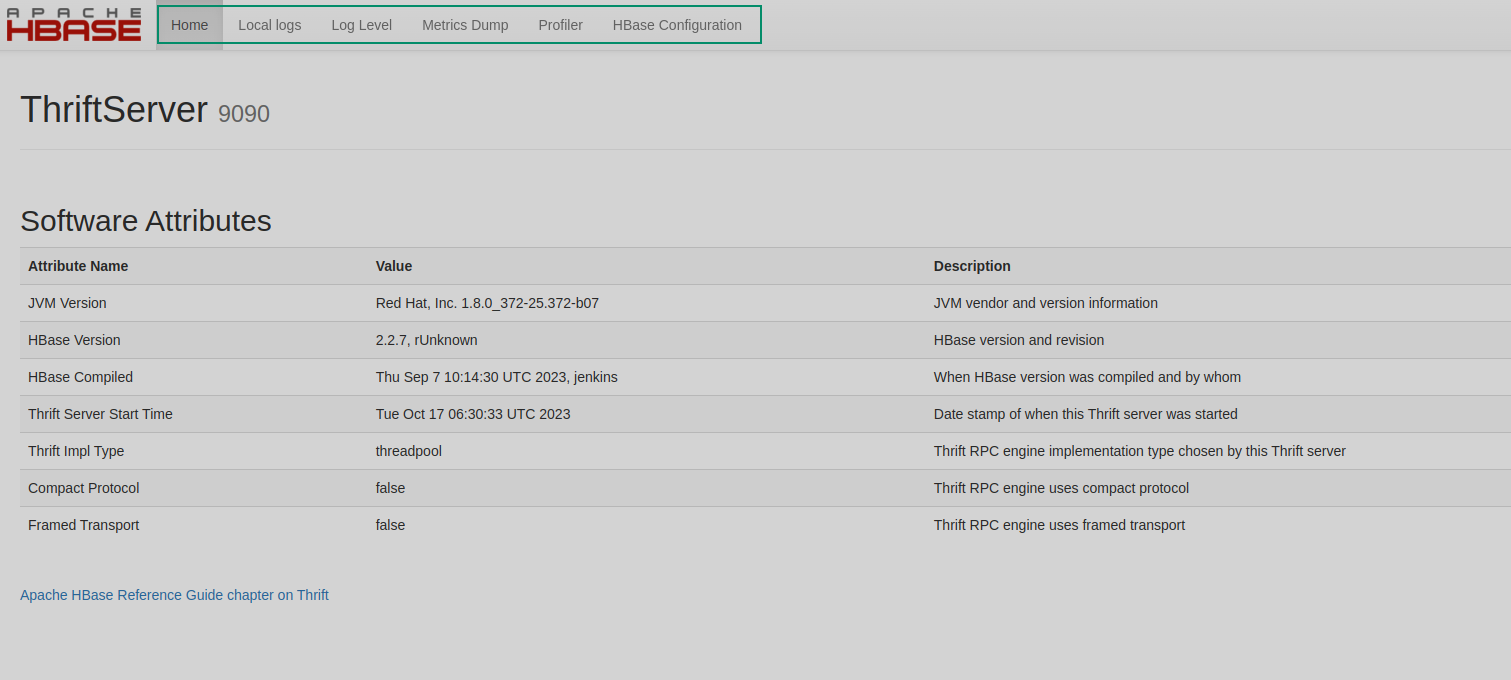
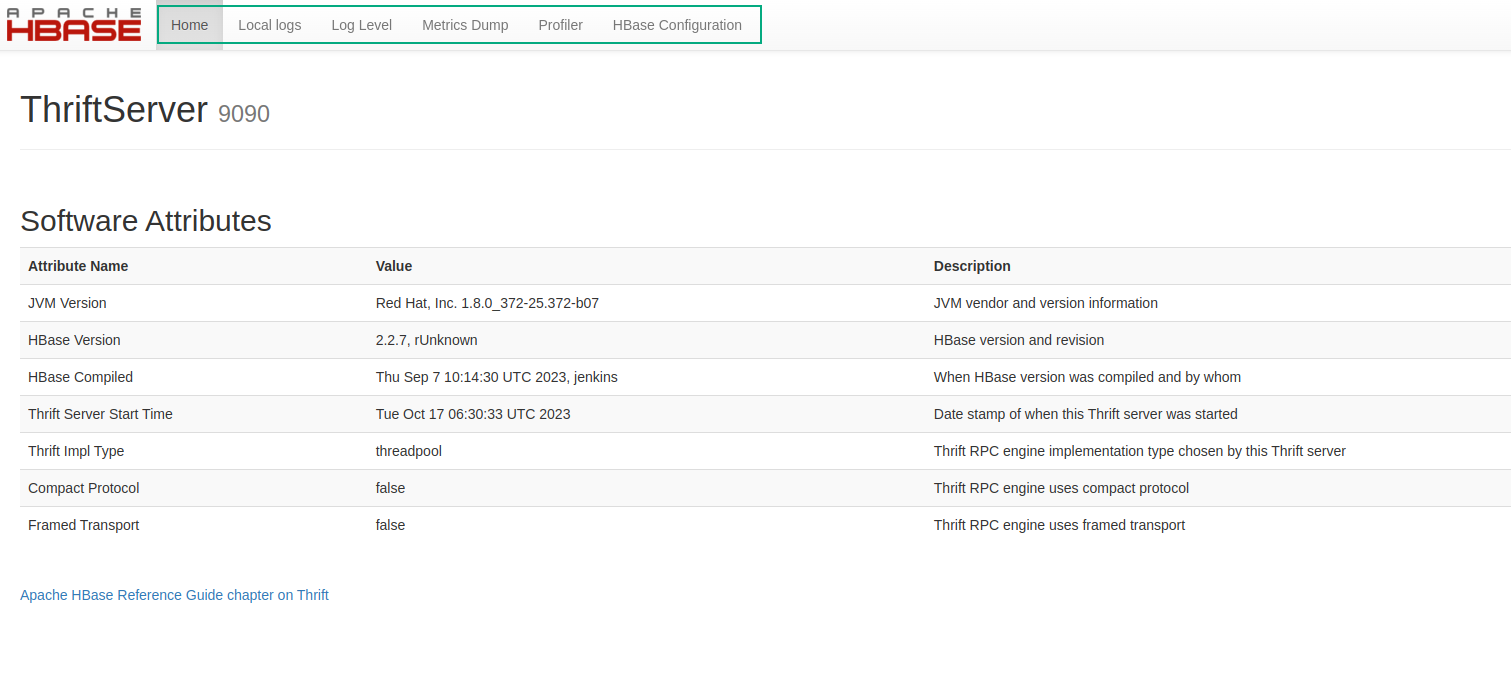
Home
The Home tab of the Thrift2 Server UI displays the Software Attributes table with the JVM and HBase version information, Thrift2 Server start time, Thrift RPC engine implementation type chosen by the Thrift2 Server, and boolean values that show whether the Thrift RPC engine uses the compact protocol and framed transport.
Local Logs
The Local Logs tab contains a list of links to log files stored on the current host. When you click a link, the related log file opens in the browser window. In the file system, the log files are stored in the /var/log/hbase directory. For more information, see Logging in HBase.
Log Level
The Log Level tab allows you to change the log level without service restart. The log level set on this tab is applied until the service is restarted. After restart, settings from the log4j.properties file are used.
To check the log level, fill in the first Log Name field and click Get Log Level. The log name should contain class hierarchy, for example, org.apache.hadoop.hbase.
To change the log level, type a log name in the corresponding field. Fill in the Log Level field with one of the following values: TRACE, DEBUG, or INFO and click Set Log Level.
Metrics Dump
The Metrics Dump tab displays a report with metrics of the Thrift2 Server. It is the dump of the JMX bean in the JSON format.