

Performance tuning
Statements for performance tuning
Impala provides the following statements that can be used for performance tuning:
EXPLAIN
The EXPLAIN command displays the execution plan that the Impala generates for the specified statement. The command does not execute the query.
The plan includes the low-level mechanisms that Impala will use to read the data. It describes how operations will be distributed among nodes in the cluster, and how intermediate results will be combined to produce the final result set. You can review these details before running the query to check that the query will be executed efficiently. If this plan does not meet your requirements, you can modify the query to improve the performance. For example, you can change conditions in the WHERE clause, the order of tables in the JOIN statement, add subqueries, change partitioning for a table, collect column statistics and table statistics in Hive (see COMPUTE STATS Statement).
For example, the query explain select count(*) from table1; has the following output:
Query: explain select count(*) from table1
+------------------------------------------------------------+
| Explain String                                             |
+------------------------------------------------------------+
| Max Per-Host Resource Reservation: Memory=8.00KB Threads=2 |
| Per-Host Resource Estimates: Memory=10MB                   |
| Codegen disabled by planner                                |
|                                                            |
| PLAN-ROOT SINK                                             |
| |                                                          |
| 03:AGGREGATE [FINALIZE]                                    |
| |  output: sum(count(*))                                   |
| |                                                          |
| 02:EXCHANGE [UNPARTITIONED]                                |
| |                                                          |
| 01:AGGREGATE                                               |
| |  output: count(*)                                        |
| |                                                          |
| 00:SCAN HDFS [default.table1]                              |
|    HDFS partitions=1/1 files=5 size=3.99KB                 |
|    row-size=8B cardinality=5                               |
+------------------------------------------------------------+
Read the EXPLAIN plan from bottom to top:
-
The last part (
00:SCAN HDFS [default.table1]) of the plan shows the low-level details, such as the expected amount of data that will be read. It allows you to estimate the effectiveness of your partitioning strategy and table scan time based on the total data size. -
In the next step, you can see the operations that will be parallelized and performed on each Impala node.
-
The next levels show how intermediate result sets are combined and transmitted from one node to another.
You can use the EXPLAIN_LEVEL query option to control the level of detail provided in the EXPLAIN output. The allowed values of EXPLAIN_LEVEL are:
-
0orMINIMAL— displays a list with one line per operation. It is primarily useful for checking the join order in long queries where the regularEXPLAINoutput is too long to read easily. -
1orSTANDARD— the default level that shows the logical level of the query execution. -
2orEXTENDED— includes additional information to illustrate how the query planner uses statistics in decision-making processes. -
3orVERBOSE— provides the maximum level of detail. It shows how a query is split into fragments that are assembled into a pipeline for each node. This information is useful for low-level performance testing and tuning Impala, not for rewriting SQL code at the user level.
At all EXPLAIN detail levels, the plan contains a warning if any tables in the query are missing statistics. Use the COMPUTE STATS statement to collect statistics for each table and suppress this warning.
The EXPLAIN plan is also printed at the beginning of the query PROFILE report described below.
SUMMARY
The SUMMARY command displays timings of query execution steps. It allows you to determine potential performance problems. You can run SUMMARY after a query is executed to see actual performance characteristics of this query.
Example:
SELECT AVG(salary) FROM table1 WHERE position like 'manager%';

summary;
The result:
+--------------+--------+--------+----------+----------+-------+------------+----------+---------------+-----------------+
| Operator     | #Hosts | #Inst  | Avg Time | Max Time | #Rows | Est. #Rows | Peak Mem | Est. Peak Mem | Detail          |
+--------------+--------+--------+----------+----------+-------+------------+----------+---------------+-----------------+
| 03:AGGREGATE | 1      | 1      | 1.03ms   | 1.03ms   | 1     | 1          | 48.00 KB | -1 B          | MERGE FINALIZE  |
| 02:EXCHANGE  | 1      | 1      | 0ns      | 0ns      | 1     | 1          | 0 B      | -1 B          | UNPARTITIONED   |
| 01:AGGREGATE | 1      | 1      |30.79ms   | 30.79ms  | 1     | 1          | 80.00 KB | 10.00 MB      |                 |
| 00:SCAN HDFS | 1      | 1      | 5.45s    | 5.45s    | 2.21M | -1         | 64.05 MB | 432.00 MB     | default.table1  |
+--------------+--------+--------+----------+----------+-------+------------+----------+---------------+-----------------+
The different stages of the query and their timings are shown with actual and estimated values used in the query EXPLAIN plan. The AVG() function is computed for a subset of data on each node (stage 01) and then the aggregated results from all nodes are combined at the end (stage 03). You can see which stages took the most time, and whether any estimates were substantially different from the actual values.
Impala provides the MT_DOP query option, which specifies the degree of intra-node parallelism used for certain operations that can benefit from multithreaded execution. If MT_DOP is set to a value larger than 0, the #Inst column in the output shows the number of fragment instances. Impala decomposes each query into smaller units distributed across the cluster, and these units are called fragments. When the MT_DOP query option is set to 0, the #Inst column shows the same value as the #Hosts column, since there is exactly one fragment for each host.
The SUMMARY output is also displayed in the query PROFILE report described below.
PROFILE
The PROFILE command generates a detailed, low-level report that shows how the last query was executed. The report contains many parameters. You can find PROFILE output fragments below.
Query Runtime Profile:
Query (id=36493a18ee92e275:1c04f39000000000):
   - InactiveTotalTime: 0.000ns
   - TotalTime: 0.000ns
  Summary:
    Session ID: ed440ba9e107f951:3ae2c27f67a7d6ae
    Session Type: HIVESERVER2
    HiveServer2 Protocol Version: V6
    Start Time: 2023-08-24 13:23:10.491153000
    End Time: 2023-08-24 13:23:10.604175000
    Query Type: QUERY
    Query State: FINISHED
    Impala Query State: FINISHED
    Query Status: OK
    Impala Version: impalad version 4.2.0-RELEASE RELEASE (build 978afcfae9aa626de182b2872c4469646f42e0f6)
    User: admin
    Connected User: admin
    Delegated User:
    Network Address: 10.92.6.52:47426
    Default Db: default
    Sql Statement: SELECT AVG(field1) FROM table1 WHERE field3 like 'row%'
    Coordinator: ees-1adh.ru-central1.internal:27000
    Query Options (set by configuration): EXPLAIN_LEVEL=VERBOSE,TIMEZONE=UTC,CLIENT_IDENTIFIER=Impala Shell v4.2.0-RELEASE (978afcf) built on Mon Jun  5 16:33:03 UTC 2023,DEFAULT_FILE_FORMAT=PARQUET
    Query Options (set by configuration and planner): EXPLAIN_LEVEL=VERBOSE,NUM_NODES=1,NUM_SCANNER_THREADS=1,RUNTIME_FILTER_MODE=OFF,MT_DOP=0,TIMEZONE=UTC,CLIENT_IDENTIFIER=Impala Shell v4.2.0-RELEASE (978afcf) built on Mon Jun  5 16:33:03 UTC 2023,DEFAULT_FILE_FORMAT=PARQUET,SPOOL_QUERY_RESULTS=0
...

Estimated Per-Host Mem: 16793600
Request Pool: default-pool
Per Host Min Memory Reservation: ees-1adh.ru-central1.internal:27000(16.00 KB)
Per Host Number of Fragment Instances: ees-1adh.ru-central1.internal:27000(1)
Admission result: Admitted immediately
Cluster Memory Admitted: 16.02 MB
Executor Group: empty group (using coordinator only)
ExecSummary:
Operator       #Hosts  #Inst  Avg Time  Max Time  #Rows  Est. #Rows  Peak Mem  Est. Peak Mem  Detail
-------------------------------------------------------------------------------------------------------------
F00:ROOT            1      1   0.000ns   0.000ns                            0              0
01:AGGREGATE        1      1   0.000ns   0.000ns      1           1  37.00 KB       16.00 KB  FINALIZE
00:SCAN HDFS        1      1   5.000ms   5.000ms     15           1  85.00 KB       16.00 MB  default.table1
    Errors:
    Query Compilation: 8.502ms
       - Metadata of all 1 tables cached: 1.585ms (1.585ms)
       - Analysis finished: 3.044ms (1.459ms)
       - Authorization finished (noop): 3.203ms (159.571us)
       - Value transfer graph computed: 3.362ms (158.312us)
       - Single node plan created: 6.038ms (2.676ms)
       - Distributed plan created: 6.121ms (83.217us)
       - Lineage info computed: 6.312ms (190.851us)
       - Planning finished: 8.502ms (2.189ms)
    Query Timeline: 113.002ms
       - Query submitted: 0.000ns (0.000ns)
       - Planning finished: 10.000ms (10.000ms)
       - Submit for admission: 10.000ms (0.000ns)
       - Completed admission: 10.000ms (0.000ns)
       - Ready to start on 1 backends: 10.000ms (0.000ns)
       - All 1 execution backends (1 fragment instances) started: 11.000ms (1.000ms)
       - Rows available: 16.000ms (5.000ms)
       - First row fetched: 112.002ms (96.001ms)
       - Last row fetched: 112.002ms (0.000ns)
       - Released admission control resources: 113.002ms (1.000ms)
       - Unregister query: 113.002ms (0.000ns)
     - AdmissionControlTimeSinceLastUpdate: 18.000ms
     - ComputeScanRangeAssignmentTimer: 0.000ns
     - InactiveTotalTime: 0.000ns
     - TotalTime: 0.000ns
...
It shows physical query details (the number of bytes read, maximum memory usage, etc.) for each node. You can use this information to determine if the query is I/O-bound or CPU-bound, if some network condition is imposing a bottleneck, or if a slowdown is affecting some nodes but not others.
You can find descriptions of PROFILE parameters on the /profile_docs page in the impalad web UI. Use the following address syntax to access this page: http://<server‑hostname>:<port>/profile_docs. For example, http://ees-1adh.ru-central1.internal:25000/profile_docs.
Time values in the profile output reflect the wall-clock time taken by an operation. For values that represent system time or user time, a measurement system is reflected in the metric name, such as ScannerThreadsSysTime or ScannerThreadsUserTime. For example, a multi-threaded I/O operation can show a small value for wall-clock time, while the corresponding system time is larger. It represents the sum of the CPU time taken by each thread. A wall-clock time value also can be larger because it includes waiting time, while the corresponding system and user time values only measure the time while an operation actively uses CPU.
Impala displays the EXPLAIN and SUMMARY outputs at the beginning of the PROFILE report to allow you to examine both the logical and physical levels of the query.
The result of the PROFILE command contains the Per Node Profiles section. It includes the following metrics that can be controlled by the RESOURCE_TRACE_RATIO query option:
-
CpuIoWaitPercentage — the percentage of time that the CPU (or CPUs) were idle during which the system had pending disk I/O requests.
-
CpuSysPercentage — the percentage of CPU used by the system.
-
CpuUserPercentage — the percentage of CPU used by a user.
-
HostDiskReadThroughput — data read by the host as part of the execution of this query, by the HDFS data node, and by other processes running on the same system.
-
HostDiskWriteThroughput — data written by the host as part of the execution of this query, by the HDFS data node, and by other processes running on the same system.
-
HostNetworkRx — data received by the host as part of the execution of this query, other queries, and other processes running on the same system.
-
HostNetworkTx — data transmitted by the host as part of the execution of this query, other queries, and other processes running on the same system.
At present, the /profile_docs page does not include these metrics.
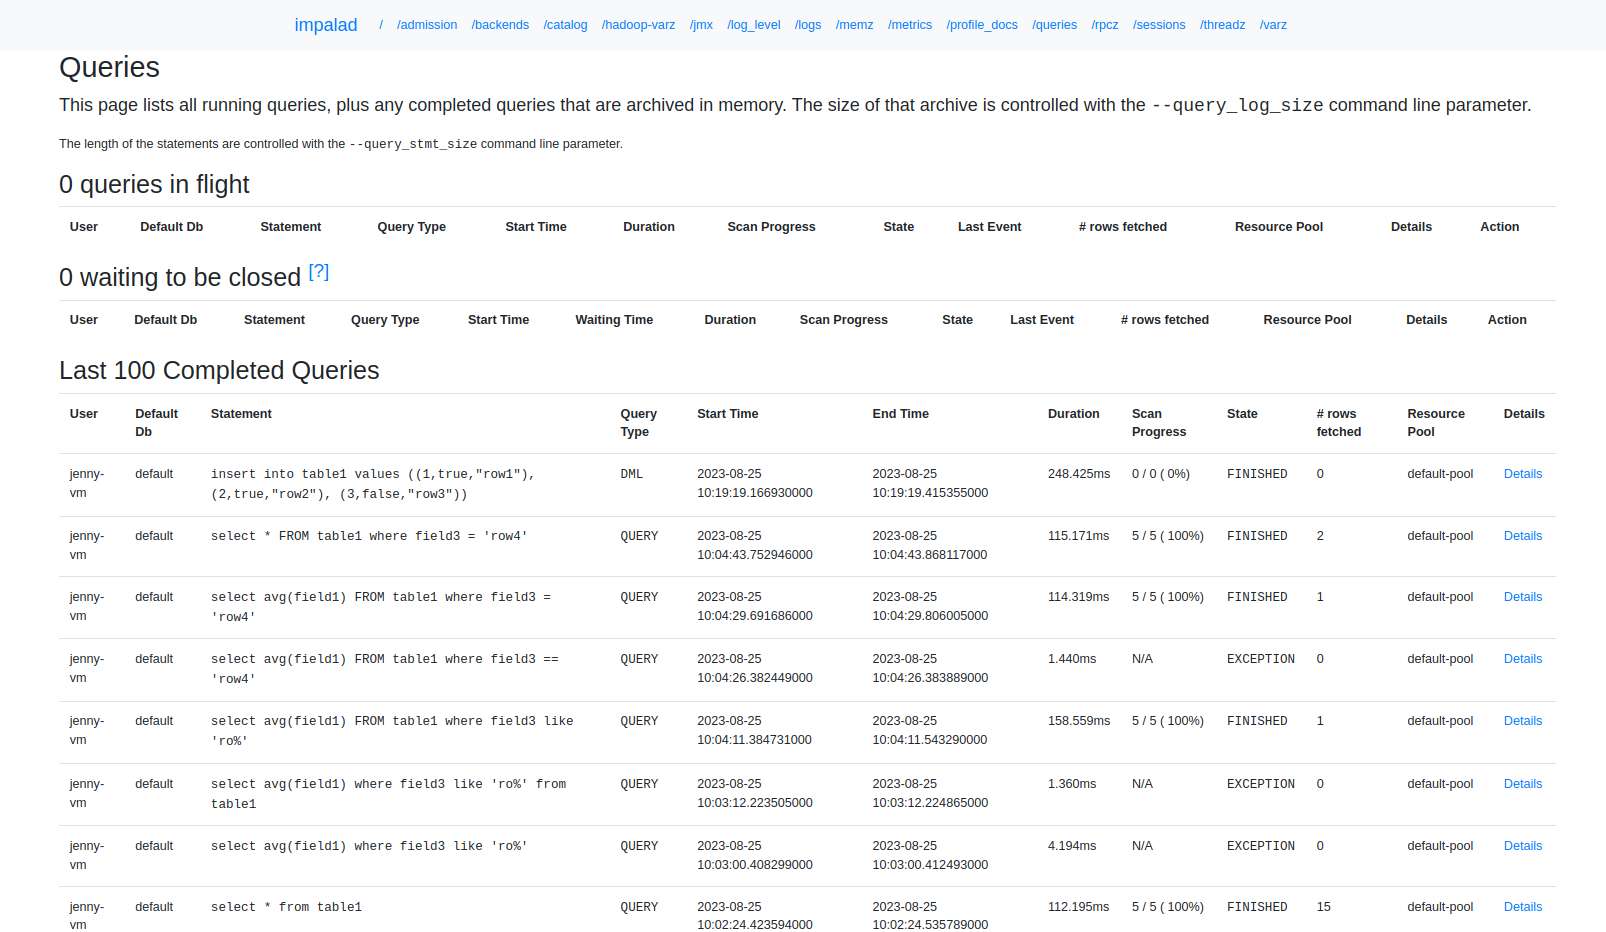
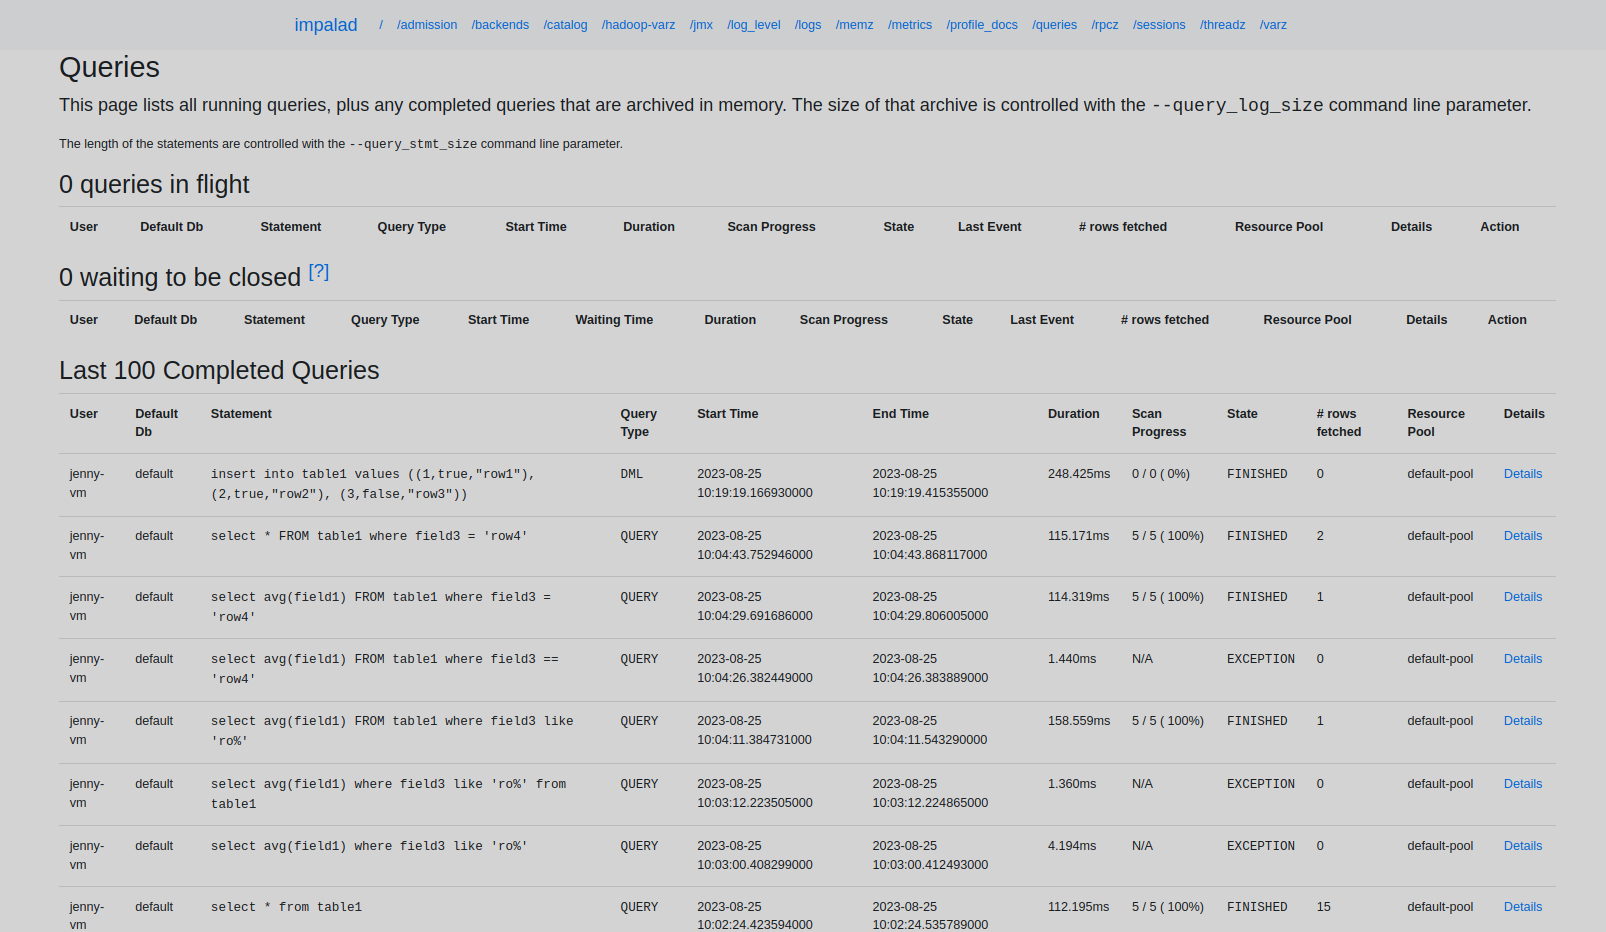
The queries page of the impalad UI
The queries page collects statistics of queries. Use the following address syntax to access this page: http://<server‑hostname>:<port>/queries. For example, http://ees-1adh.ru-central1.internal:25000/queries.
The queries page groups queries in several tables:
-
Queries in flight — running queries.
-
Waiting to be closed — queries that have completed their execution, but have not been closed yet.
-
Last 100 completed queries — the latest completed queries. You can control the number of queries and therefore the amount of memory allocated to store information about completed queries, by specifying the
--query_log_sizestartup option for impalad. -
Query Locations — shows how running queries are distributed among the impalad hosts.
The most recent queries are displayed at the top of the tables.
The Details page for each query displays detailed information about a query including a graphical representation of the plan.
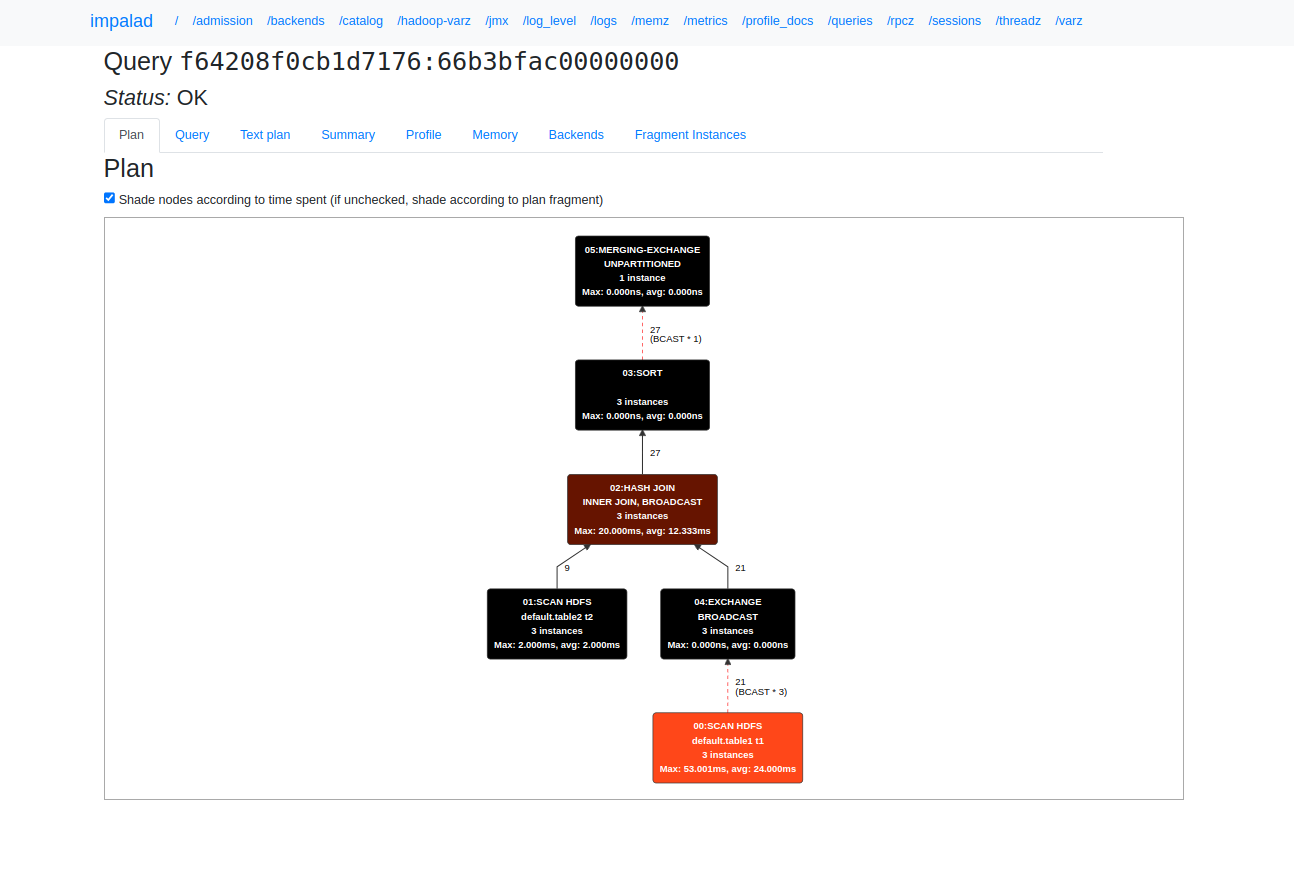
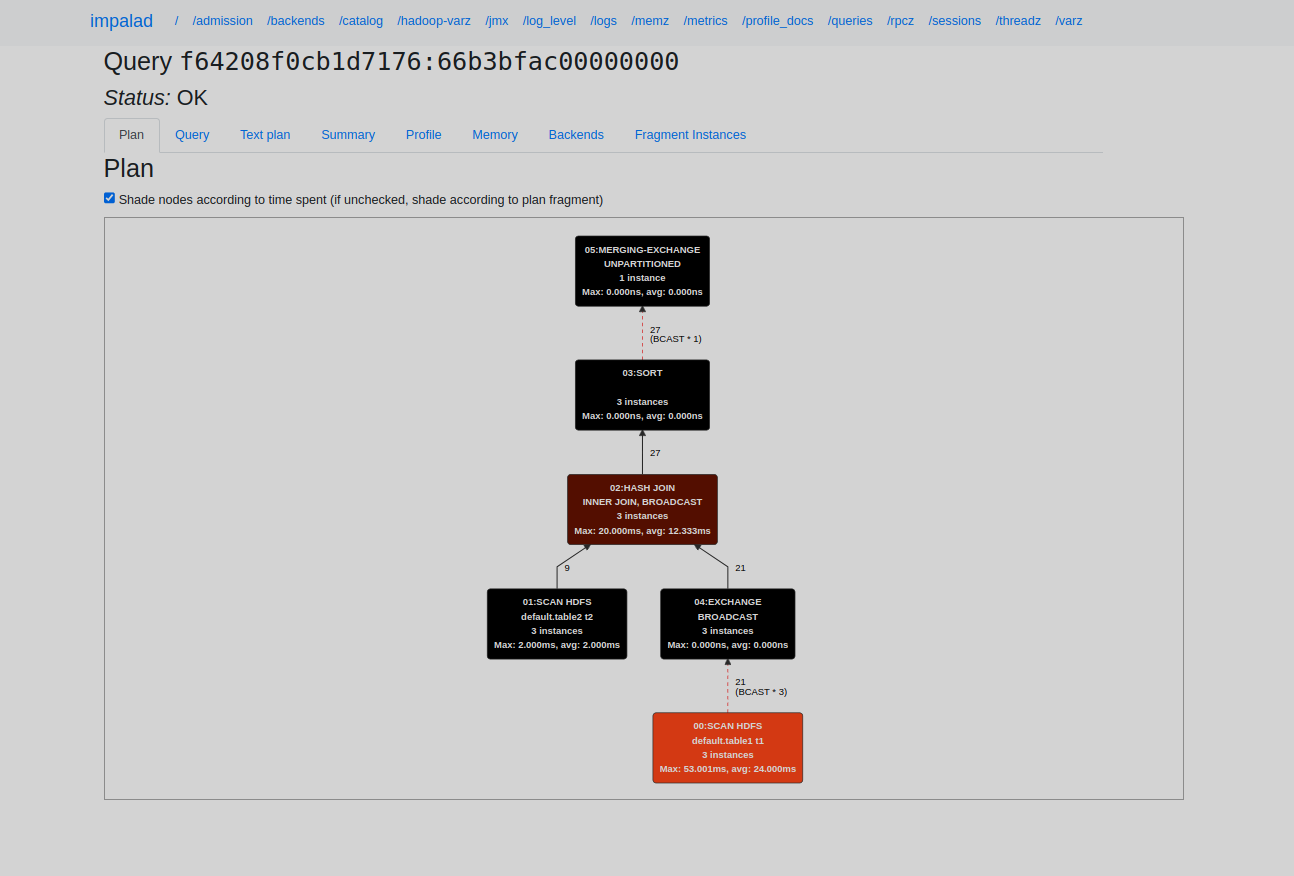
On the Details page, the following tabs are available:
-
Plan — a graphical representation of the query plan.
-
Query — query text.
-
Text plan — a query plan that is the result of the
EXPLAINcommand. -
Summary — the result of the
SUMMARYcommand. -
Profile — the result of the
PROFILEcommand. -
Memory — memory consumption. It is available during the query execution.
-
Backends — used Impala instances. It is available during the query execution.
-
Fragment instances — information about fragment instances. It is available during the query execution.
On the Profile tab, you can export the query profile output to the Thrift, JSON, or text format.