

Install monitoring
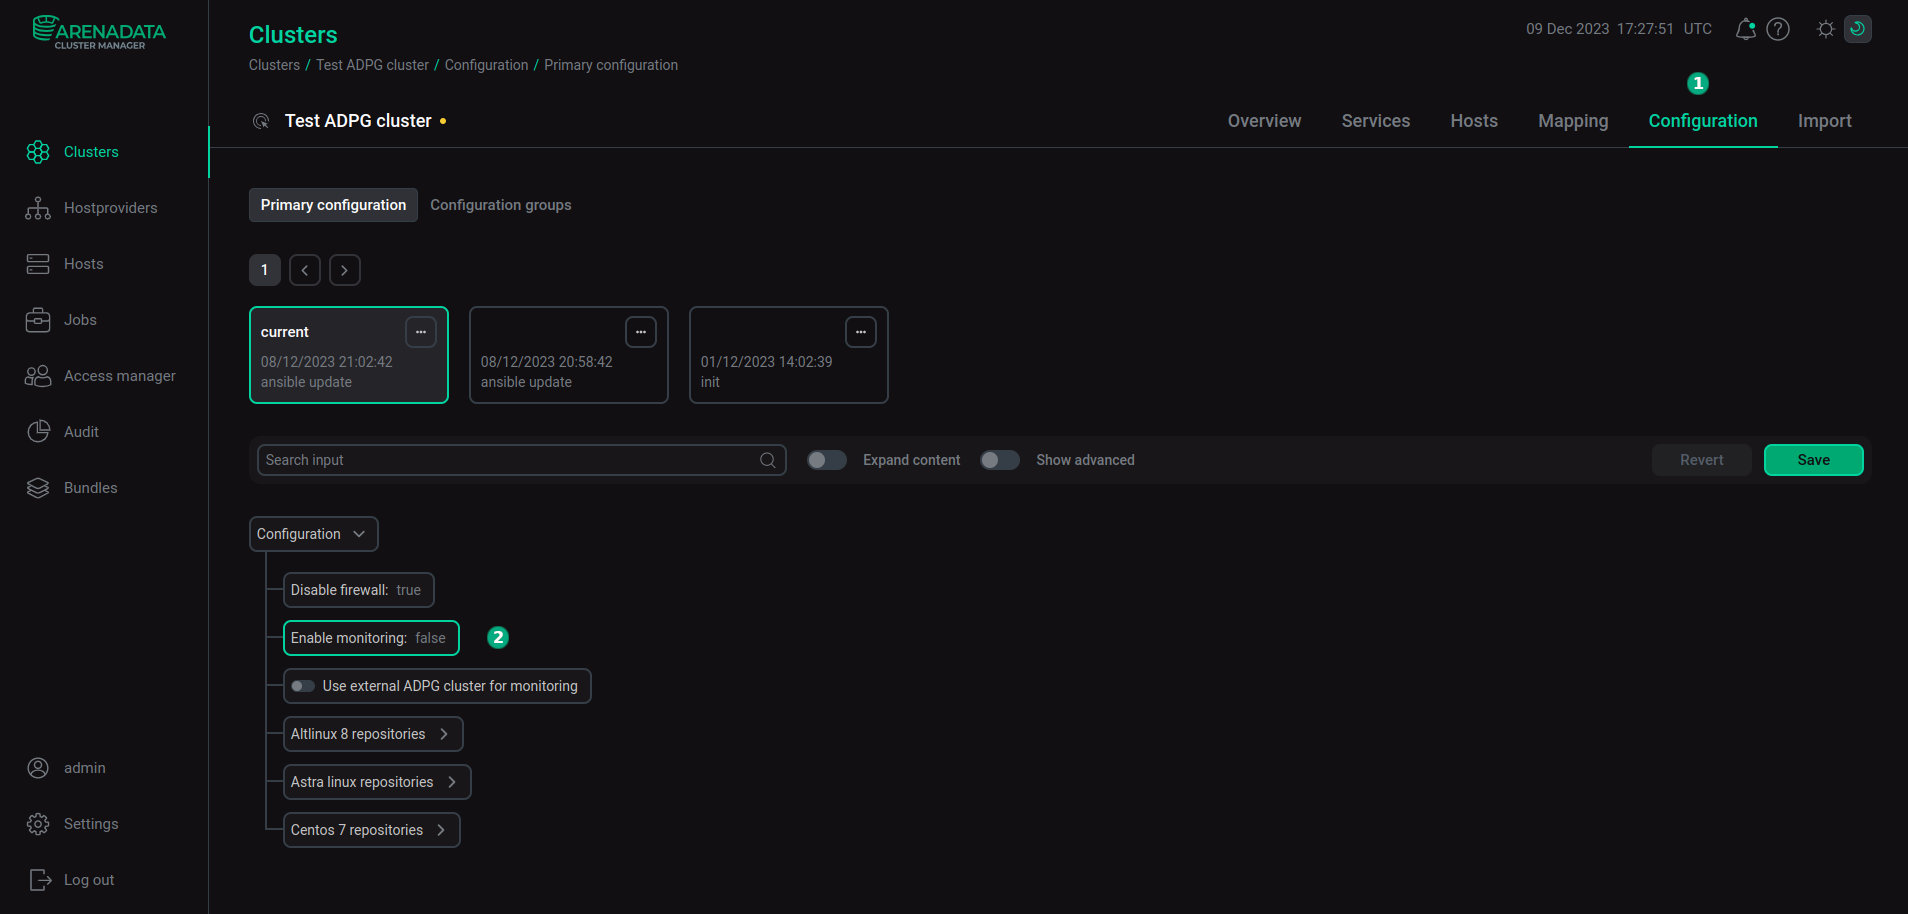
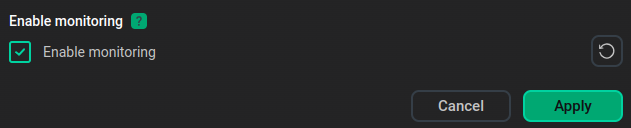
ADPG bundle includes a monitoring system. See Monitoring for details. You can enable the monitoring system during an ADPG installation or on the Clusters → ADPG cluster → Configuration → Primary configuration tab of the installed cluster. For this, click the Enable monitoring node in the configuration parameters tree, select the Enable monitoring checkbox and click Apply in the opened window. This setting also allows you to collect metrics from the current cluster.
|
NOTE
If you want to use another ADPG cluster as a metric storage, refer to Configure monitoring in an ADPG cluster.
|
To install the server side, follow the steps below:
After you configure the server side, you need to configure monitoring in an ADPG cluster and install the Metrics storage service.
Step 1. Add the Metrics storage service
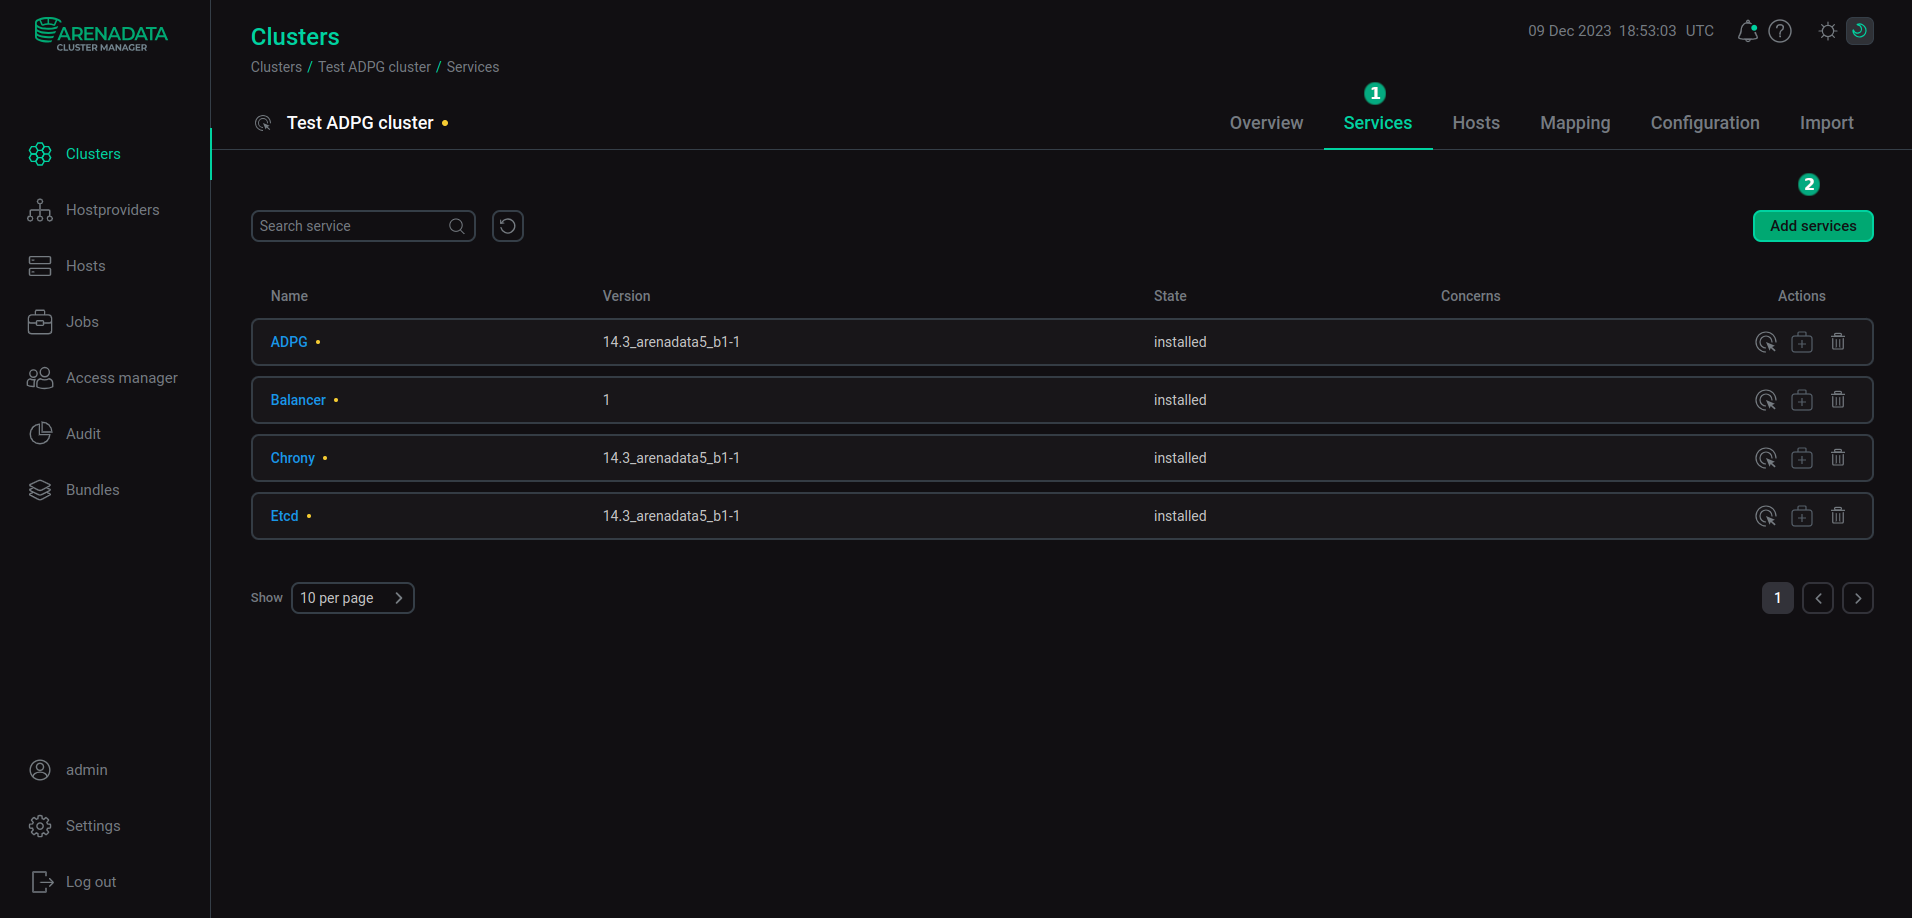
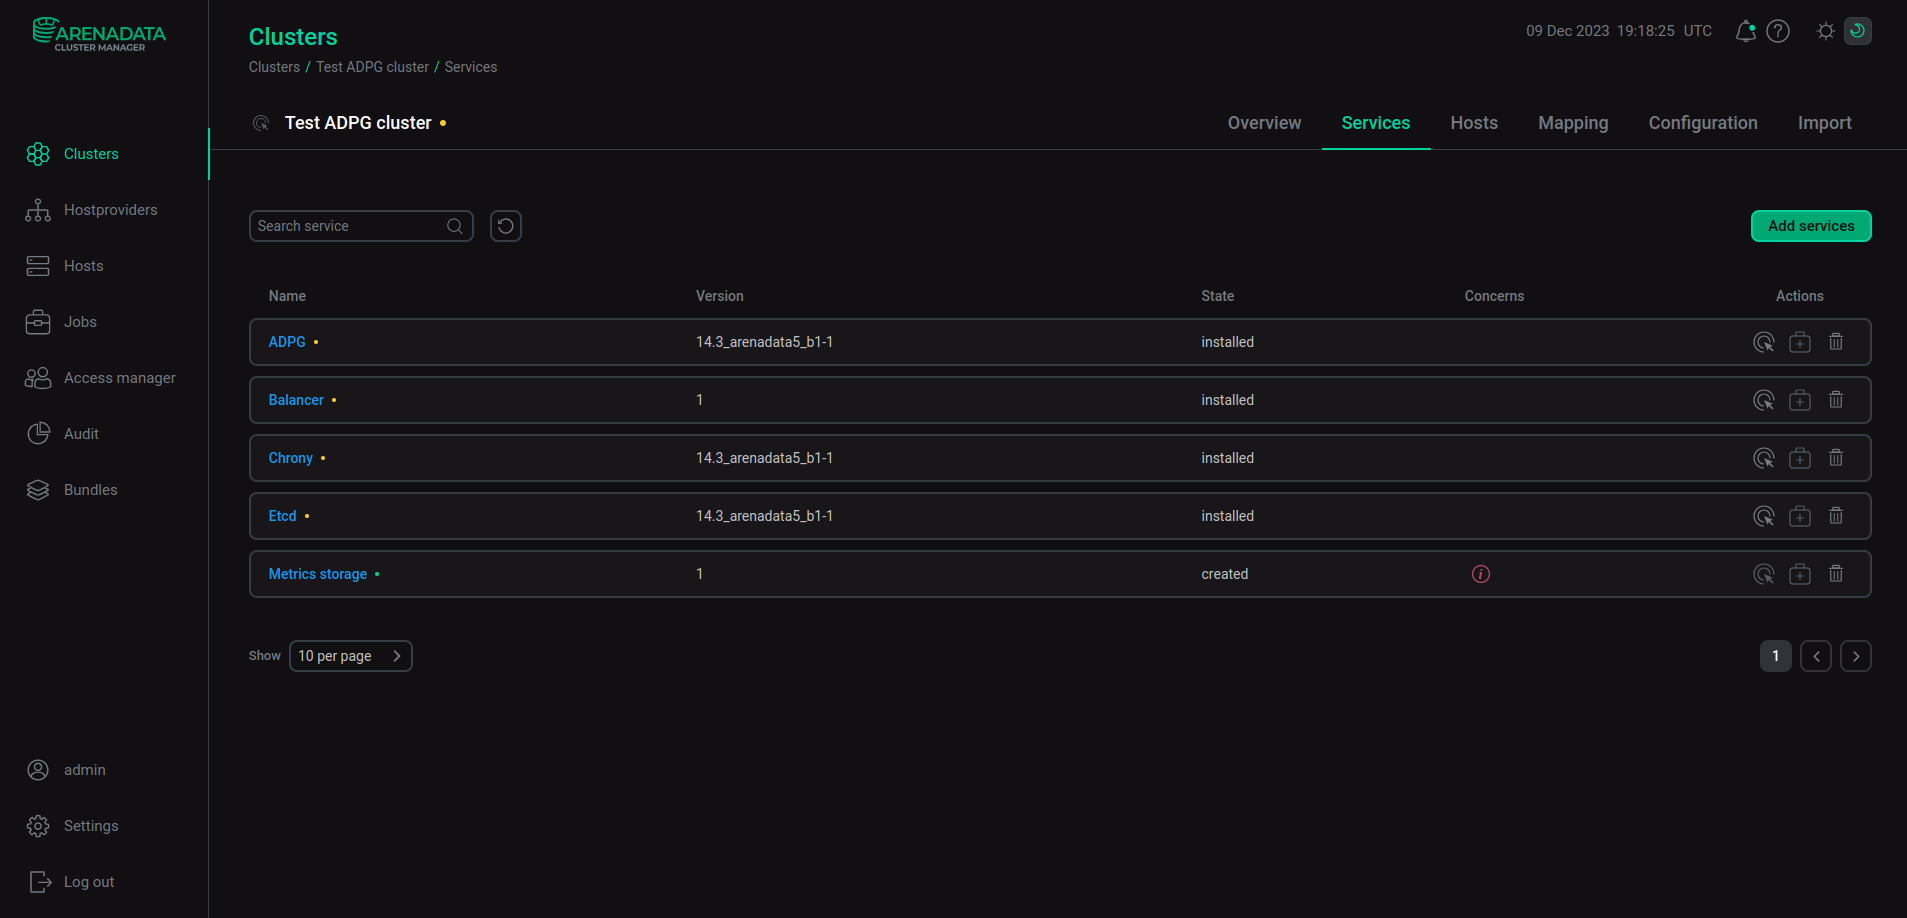
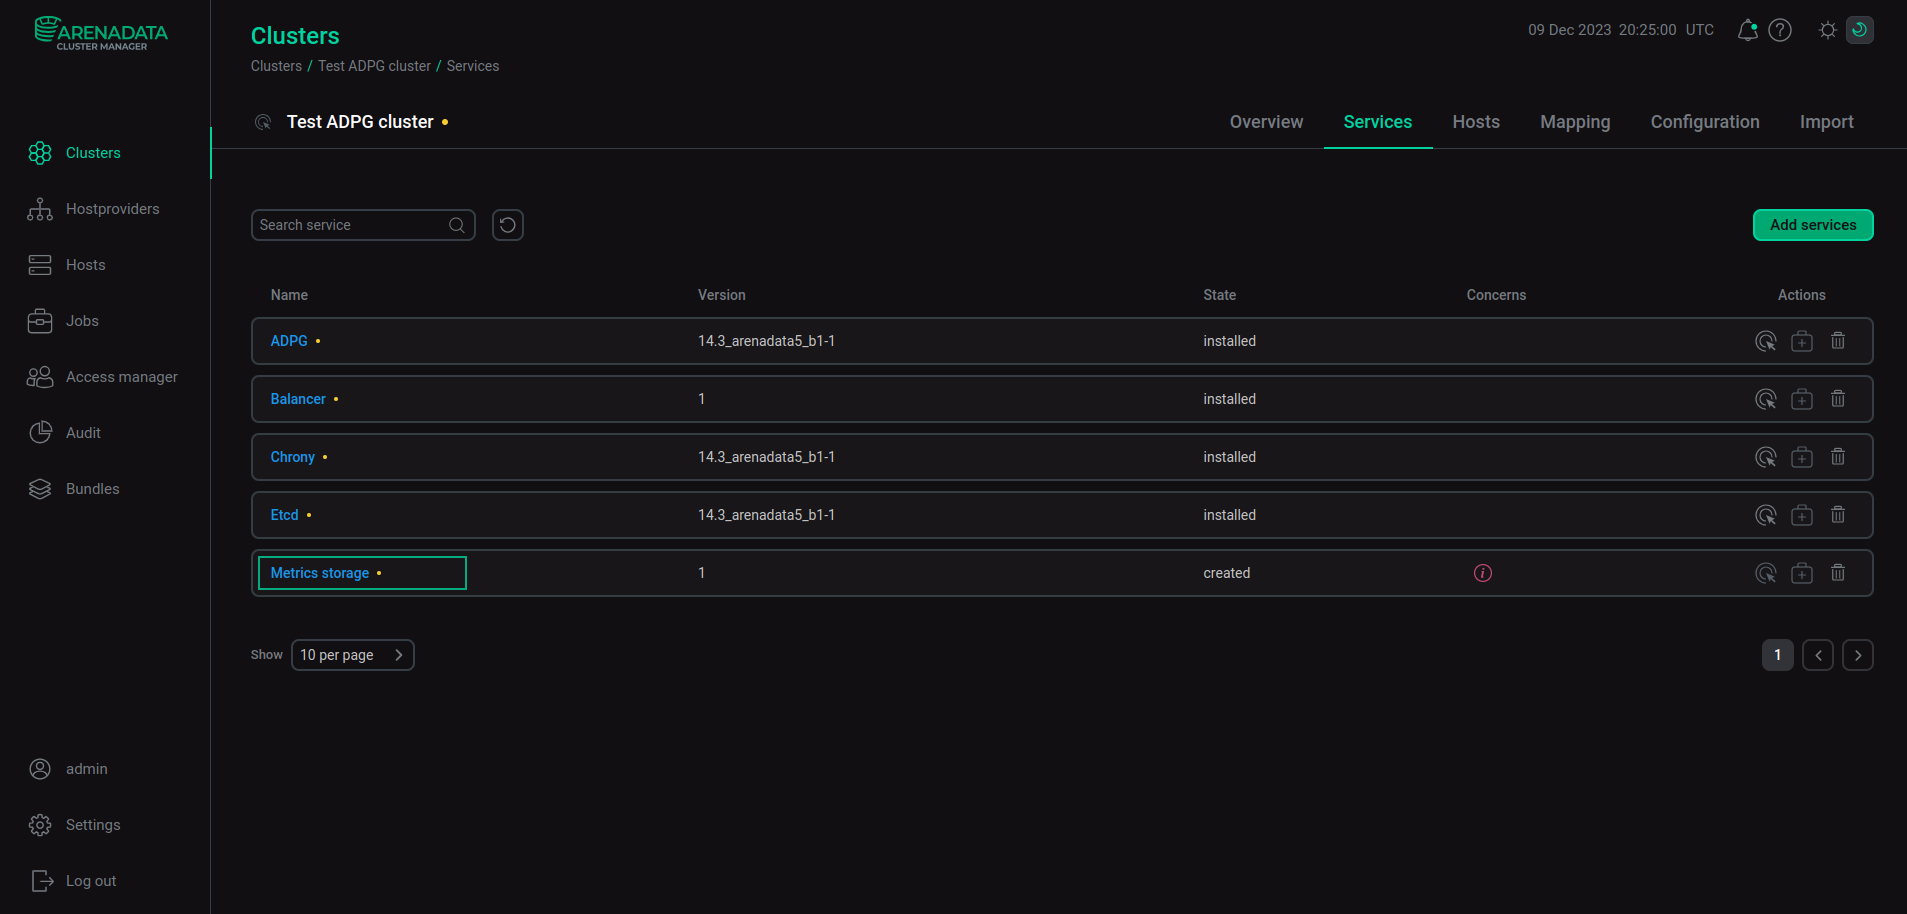
The monitoring system requires the Metrics storage service, which is used as a metric storage. To add this service, open the Clusters page and select an ADPG cluster. Open the Services tab and click Add services.
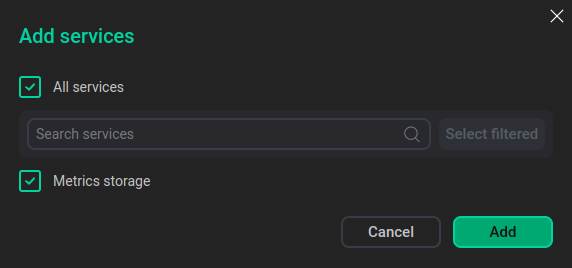
In the dialog that opens, select the Metrics storage service and click Add.
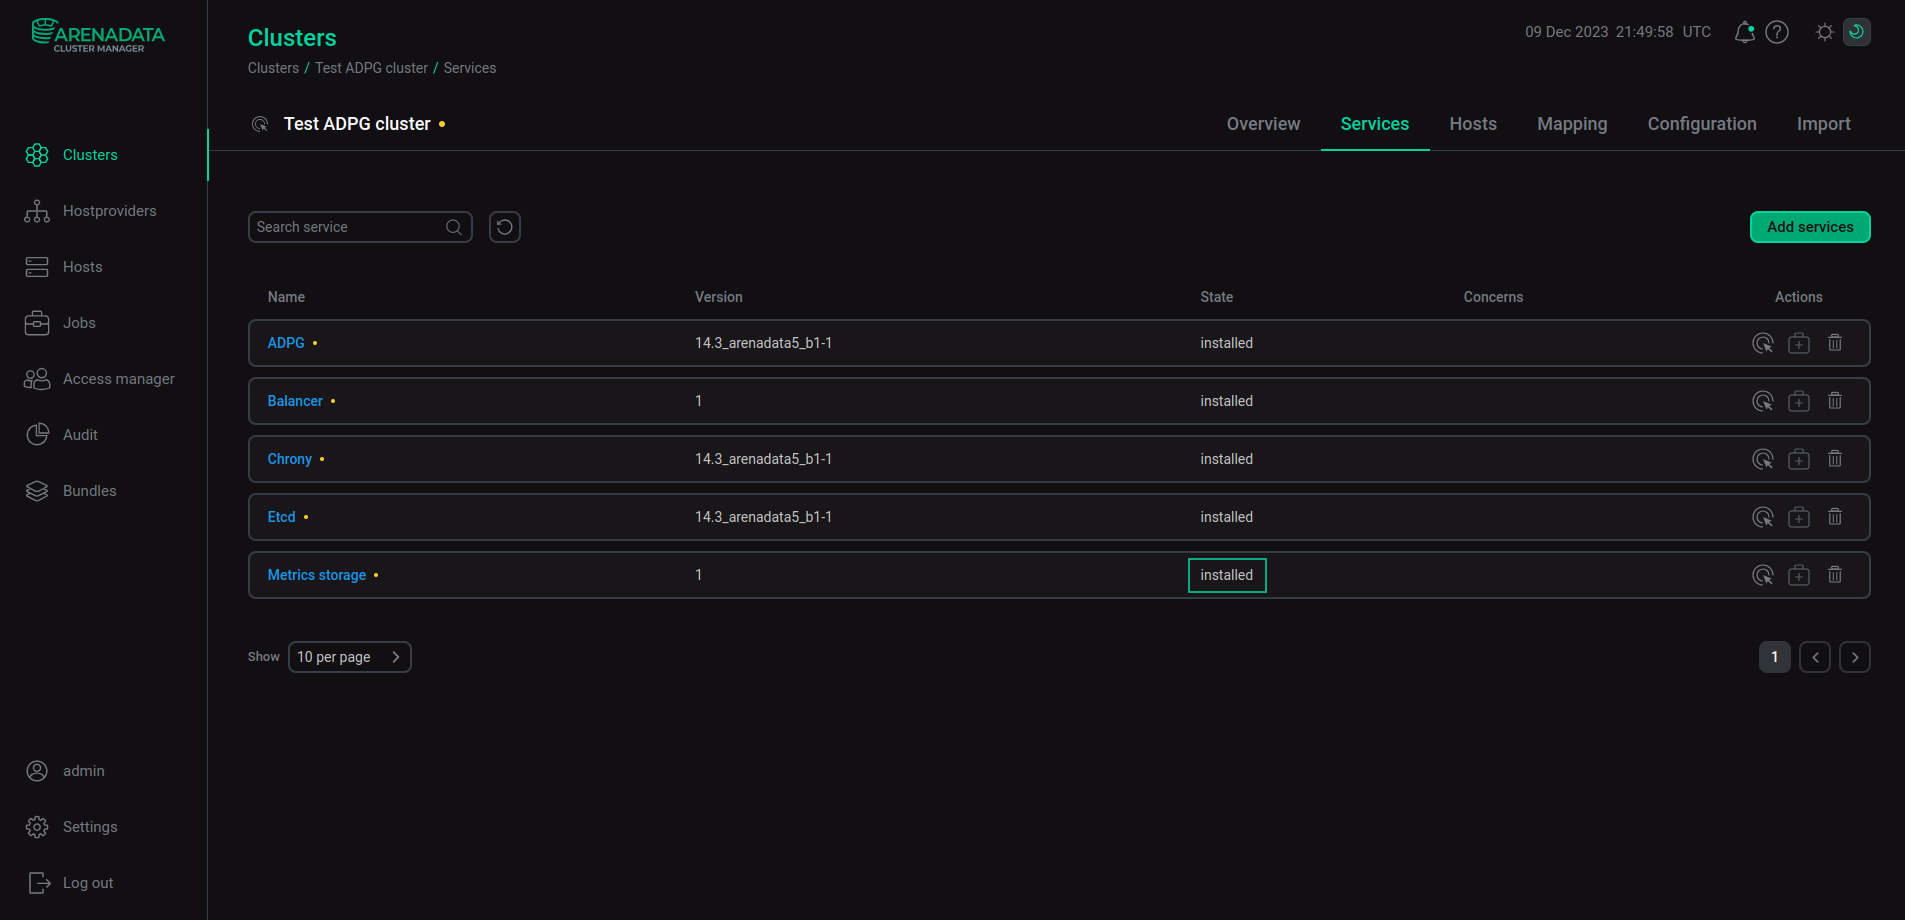
As a result, the added Metrics storage service is displayed on the Services tab.
|
NOTE
In ADPG Enterprise Edition, the Metrics storage service requires the Balancer service. For more information on this service, see Load balancing.
|
Step 2. Add the Grafana component (optional)
The ADPG monitoring system contains an optional Grafana component. Grafana visualizes metrics data and can be installed on any host of the cluster that includes the Metrics storage service.
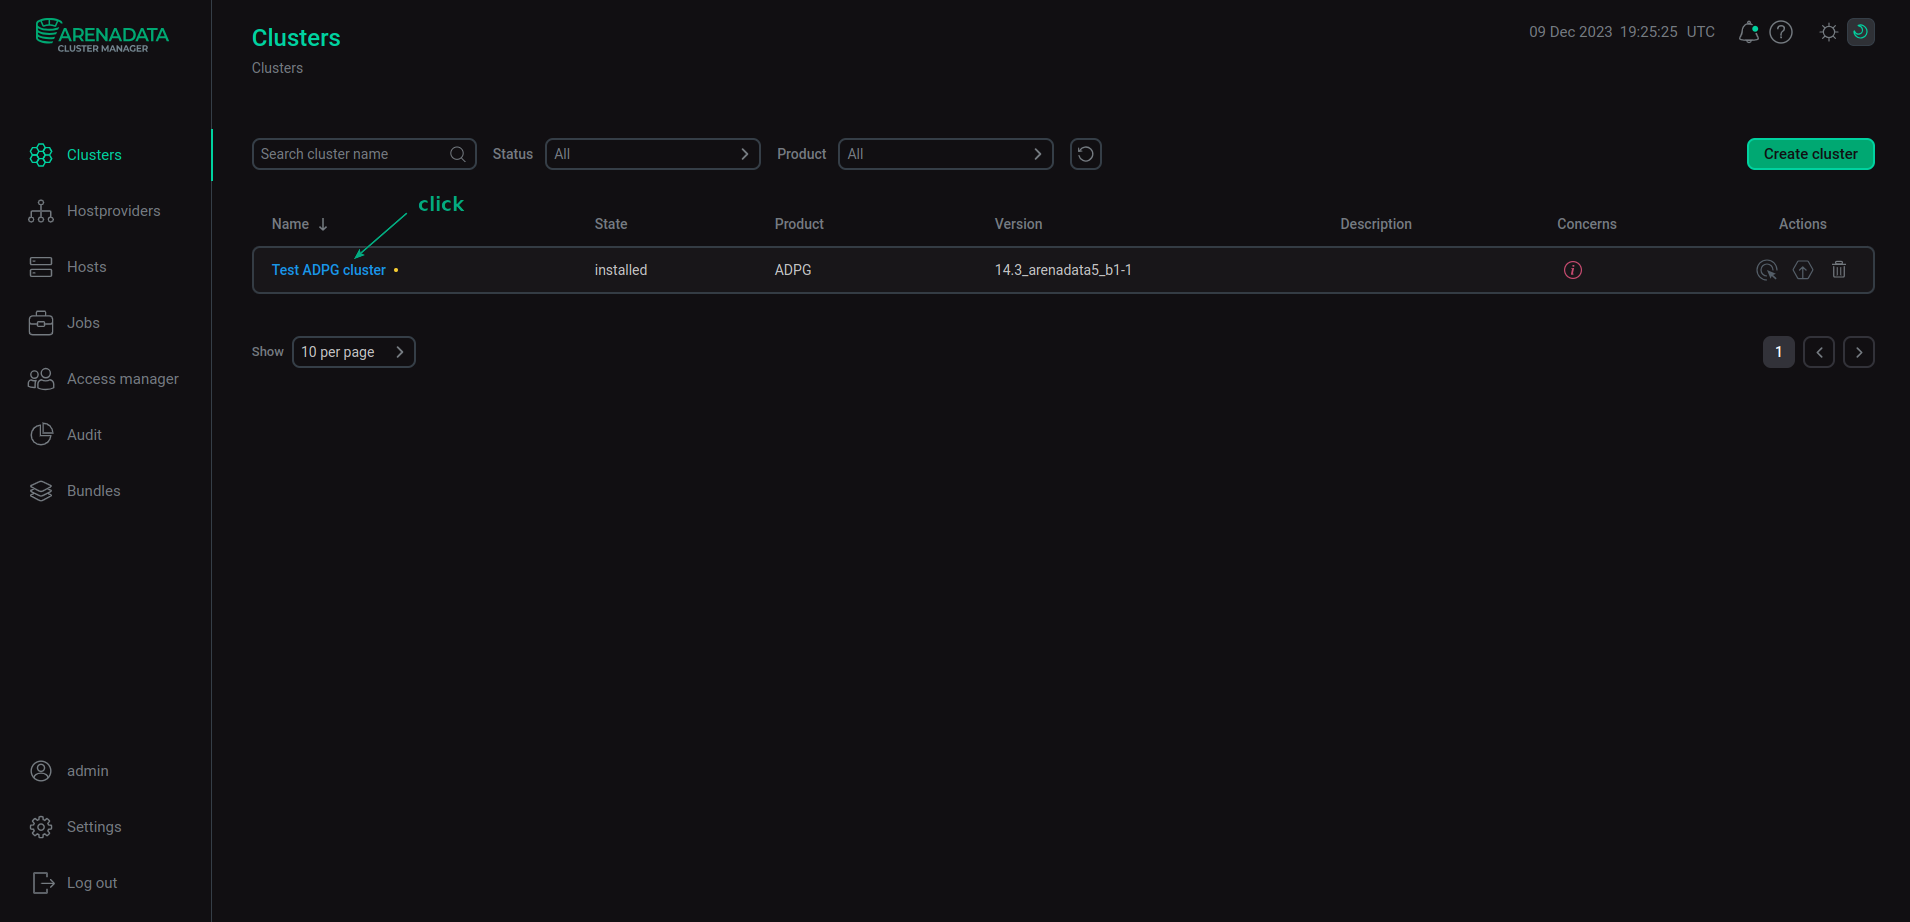
To add the Grafana component, switch to the cluster configuration from the Clusters page. To do this, click the ADPG cluster.
Open the Mapping tab in the cluster menu. On this tab, you can distribute the components among the cluster hosts.
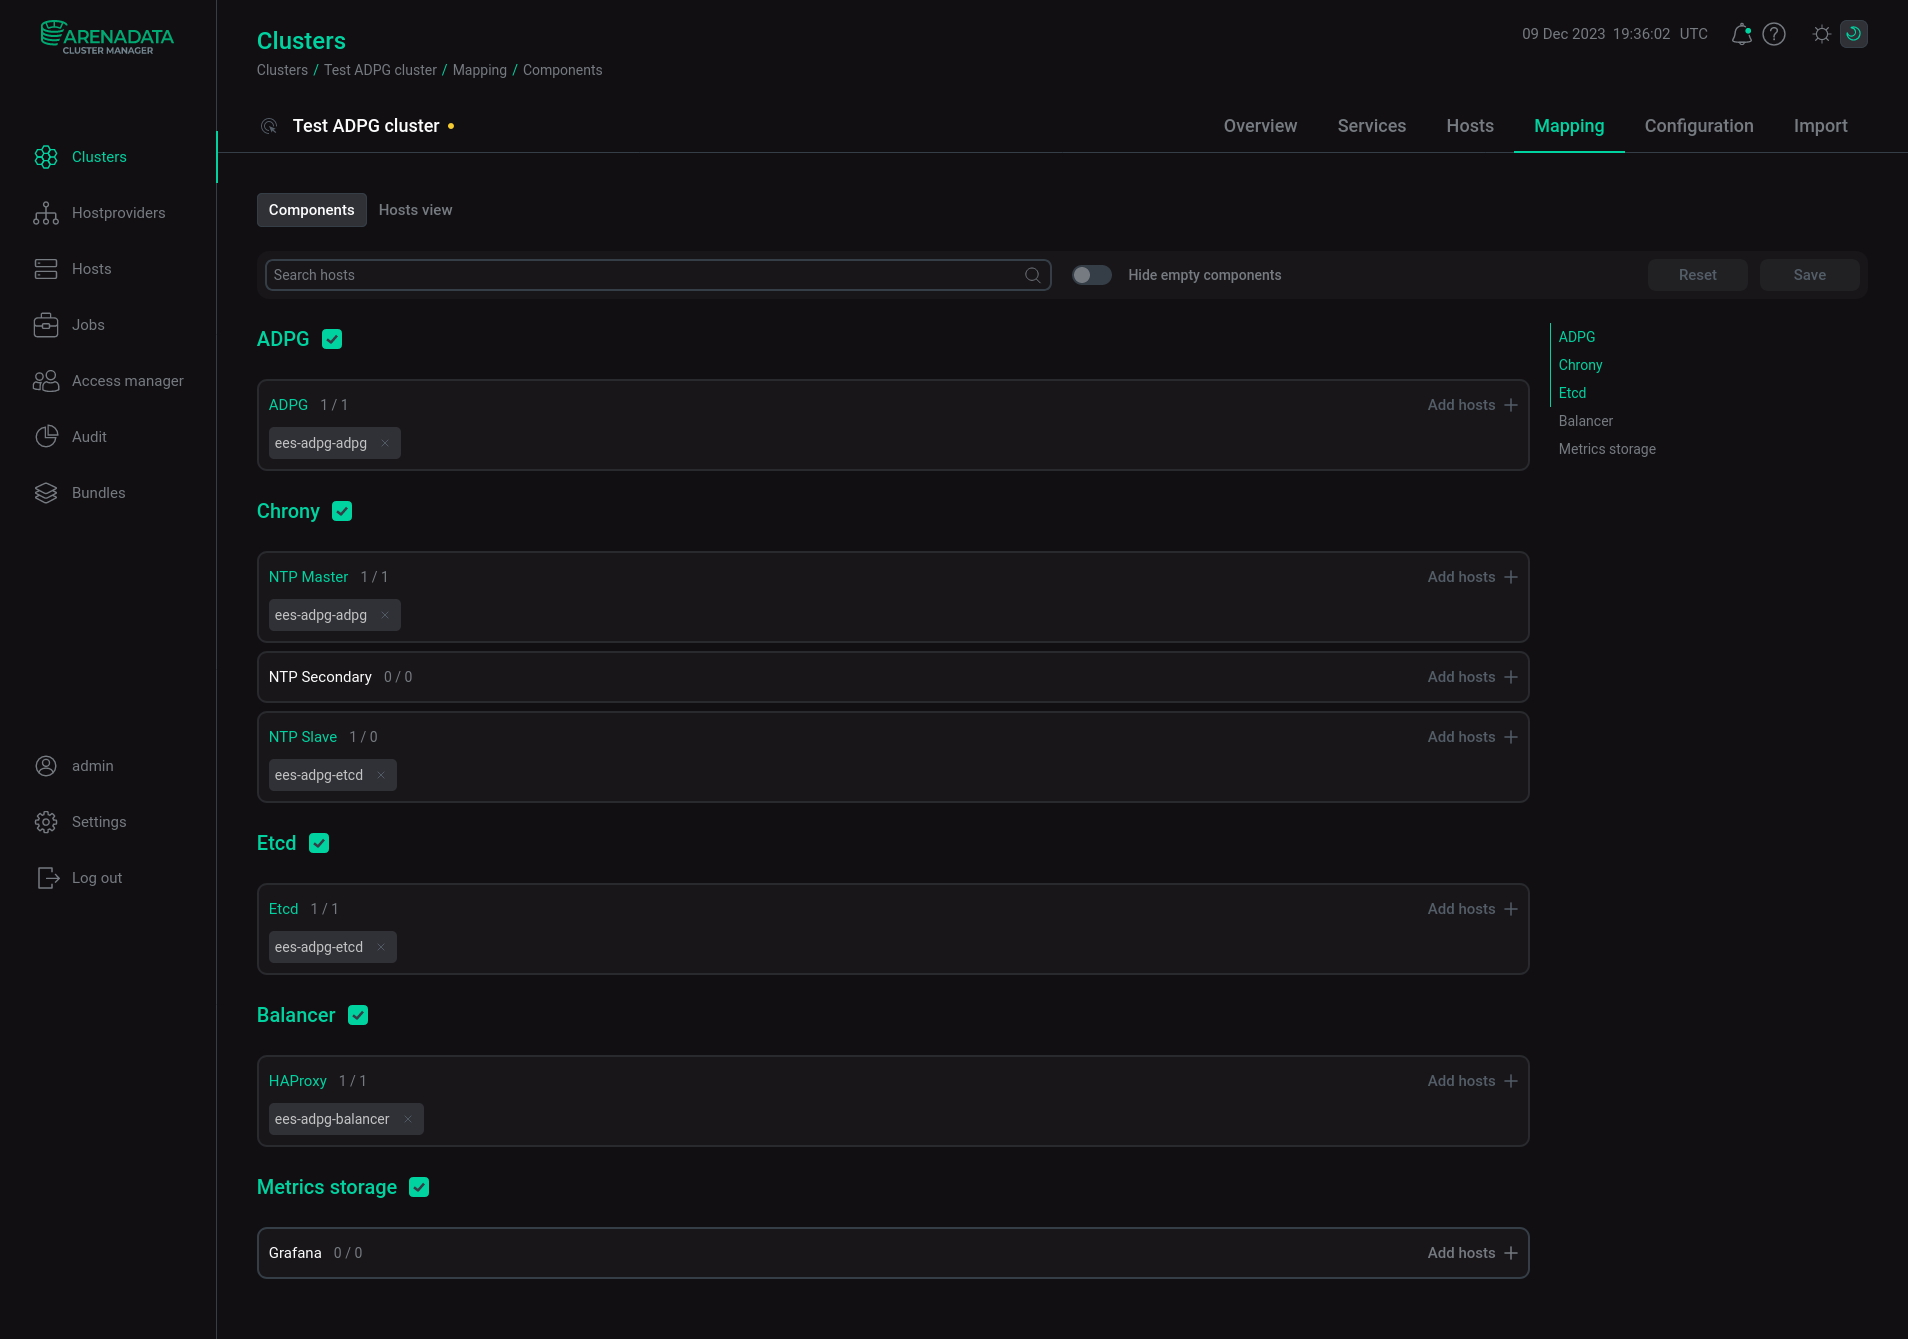
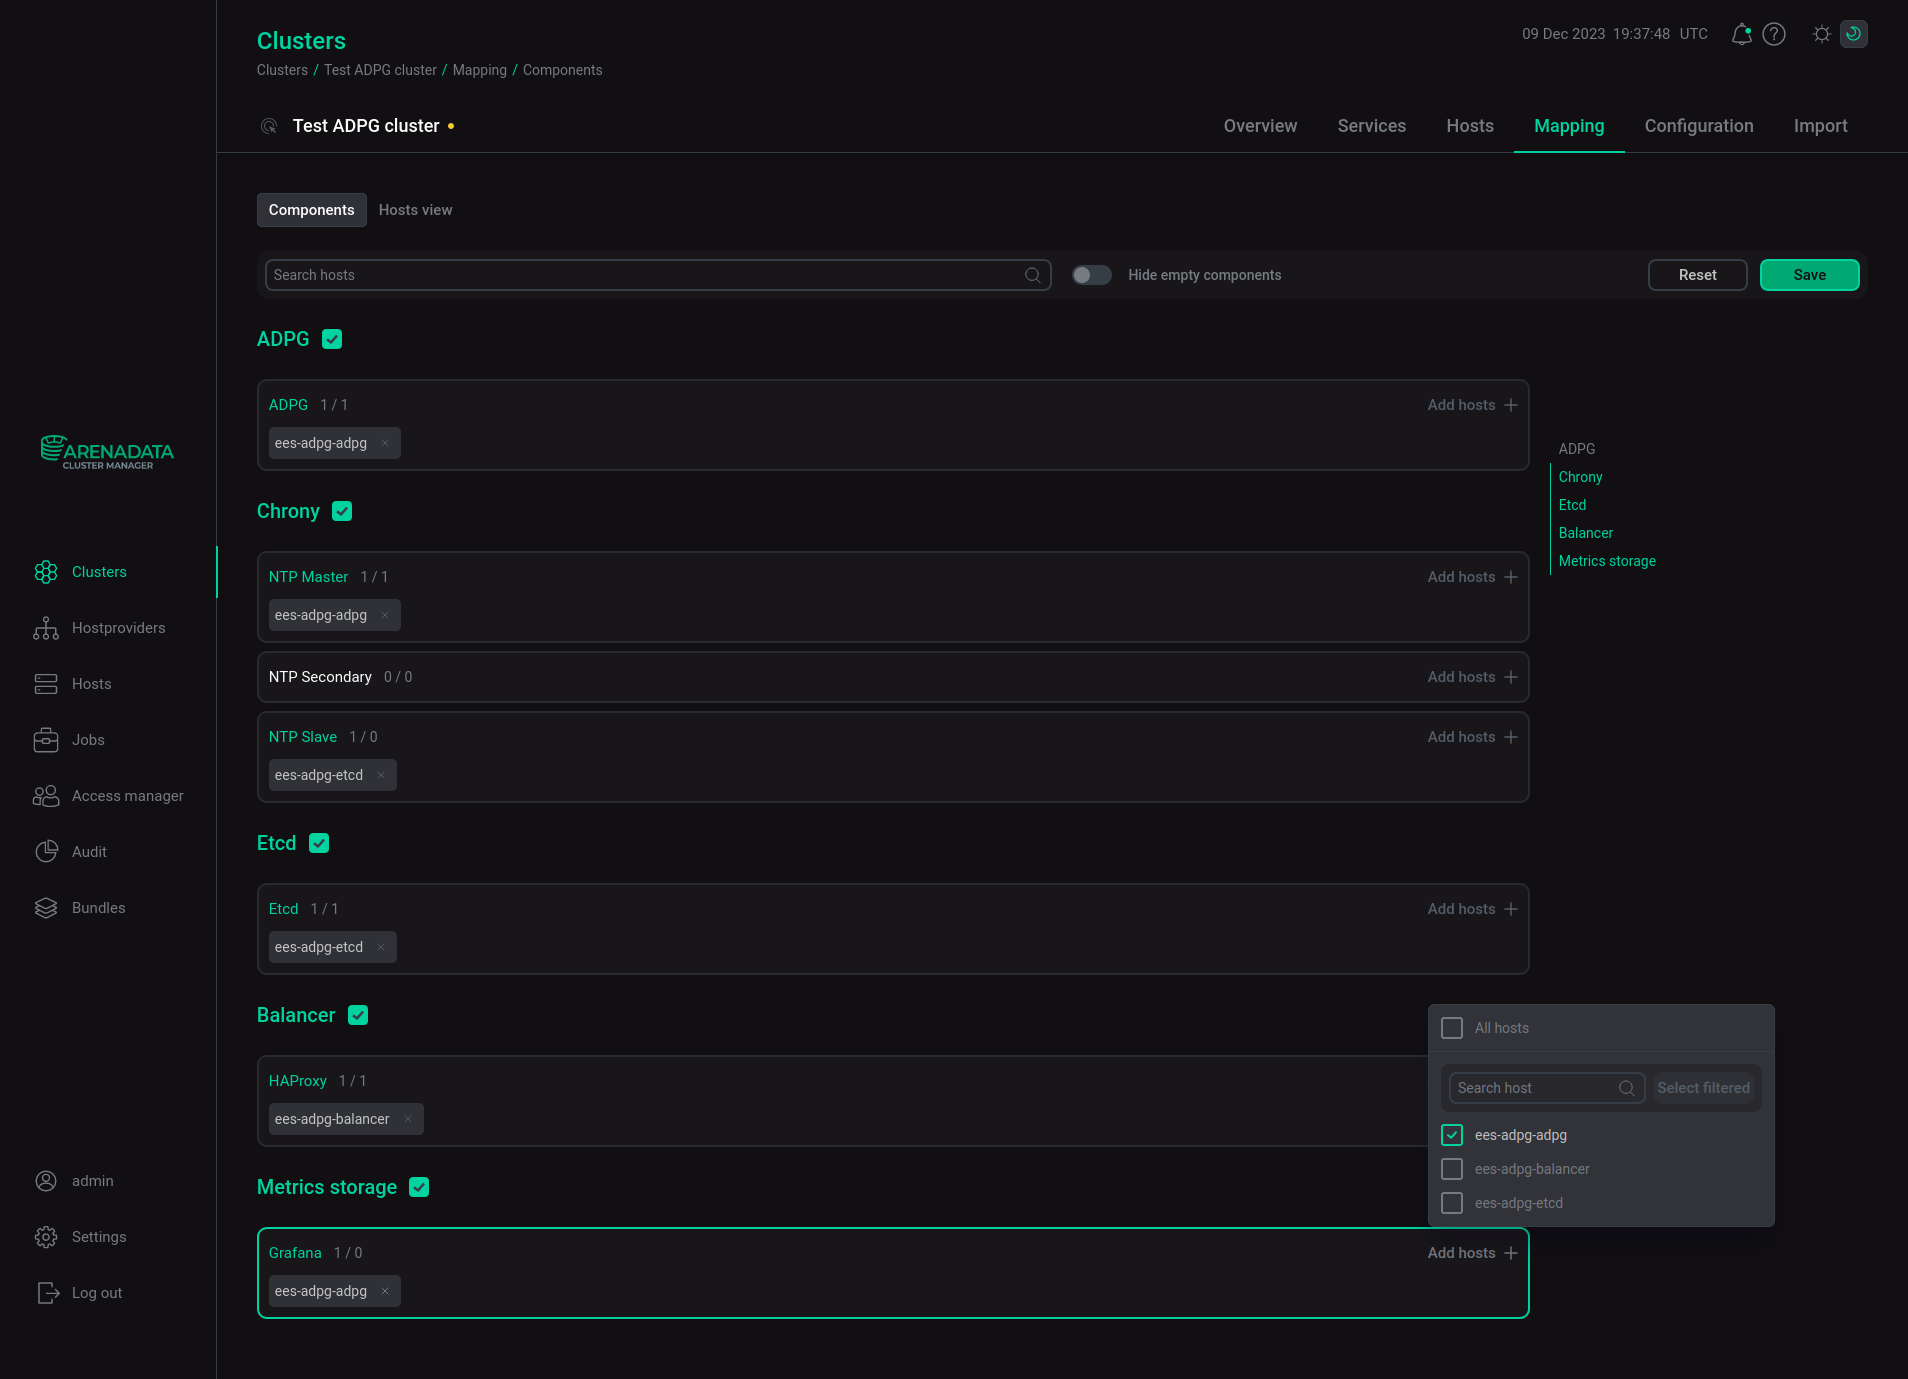
Add a host to the Grafana component of the Metrics storage service. To do this, click Add hosts, select a host in the pop-up window, and click Save.
Step 3. Configure Metrics storage
To configure the Metrics storage service, open the Services tab on the cluster page, find the row that contains the Metrics storage service, and click its name in the Name column.
The Primary configuration tab displays Metrics storage settings. Options highlighted in red are required.
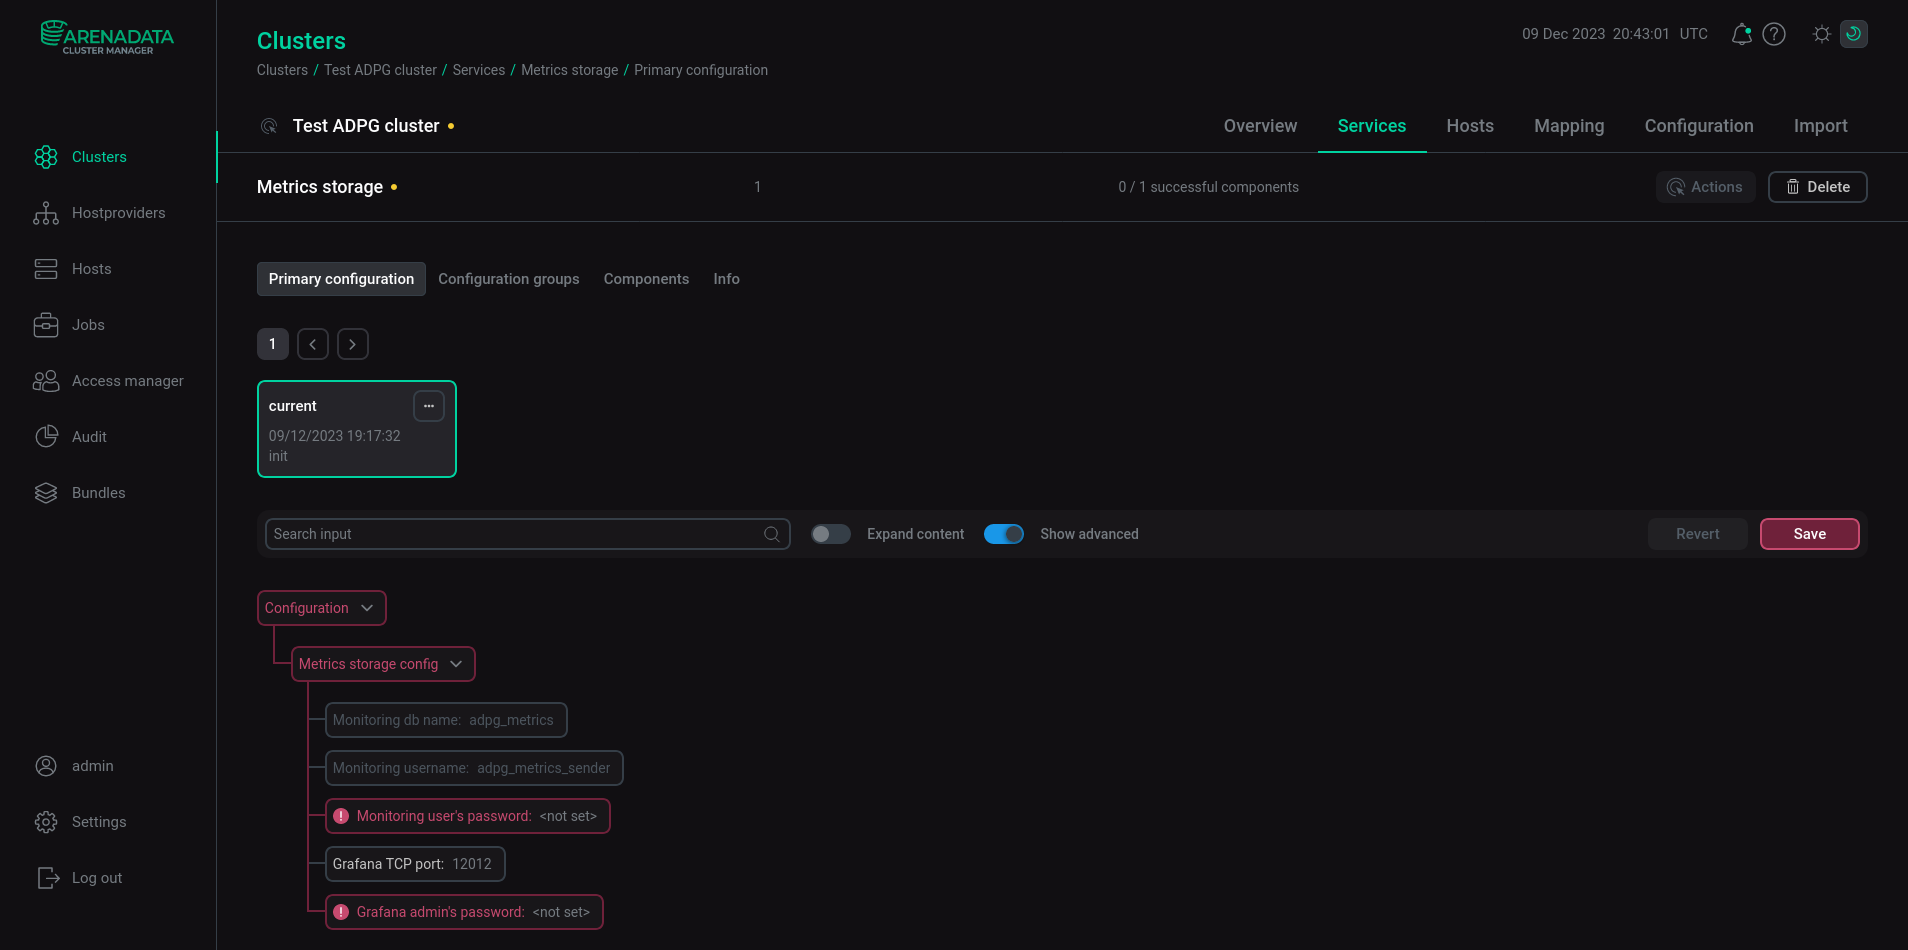
Parameters that you can specify are listed in the table below.
| Parameter | Description | Default value |
|---|---|---|
Grafana TCP port |
A port on which Grafana listens for connections |
12012 |
Grafana admin’s password |
A password for the |
— |
Monitoring user’s password |
A password that the |
— |
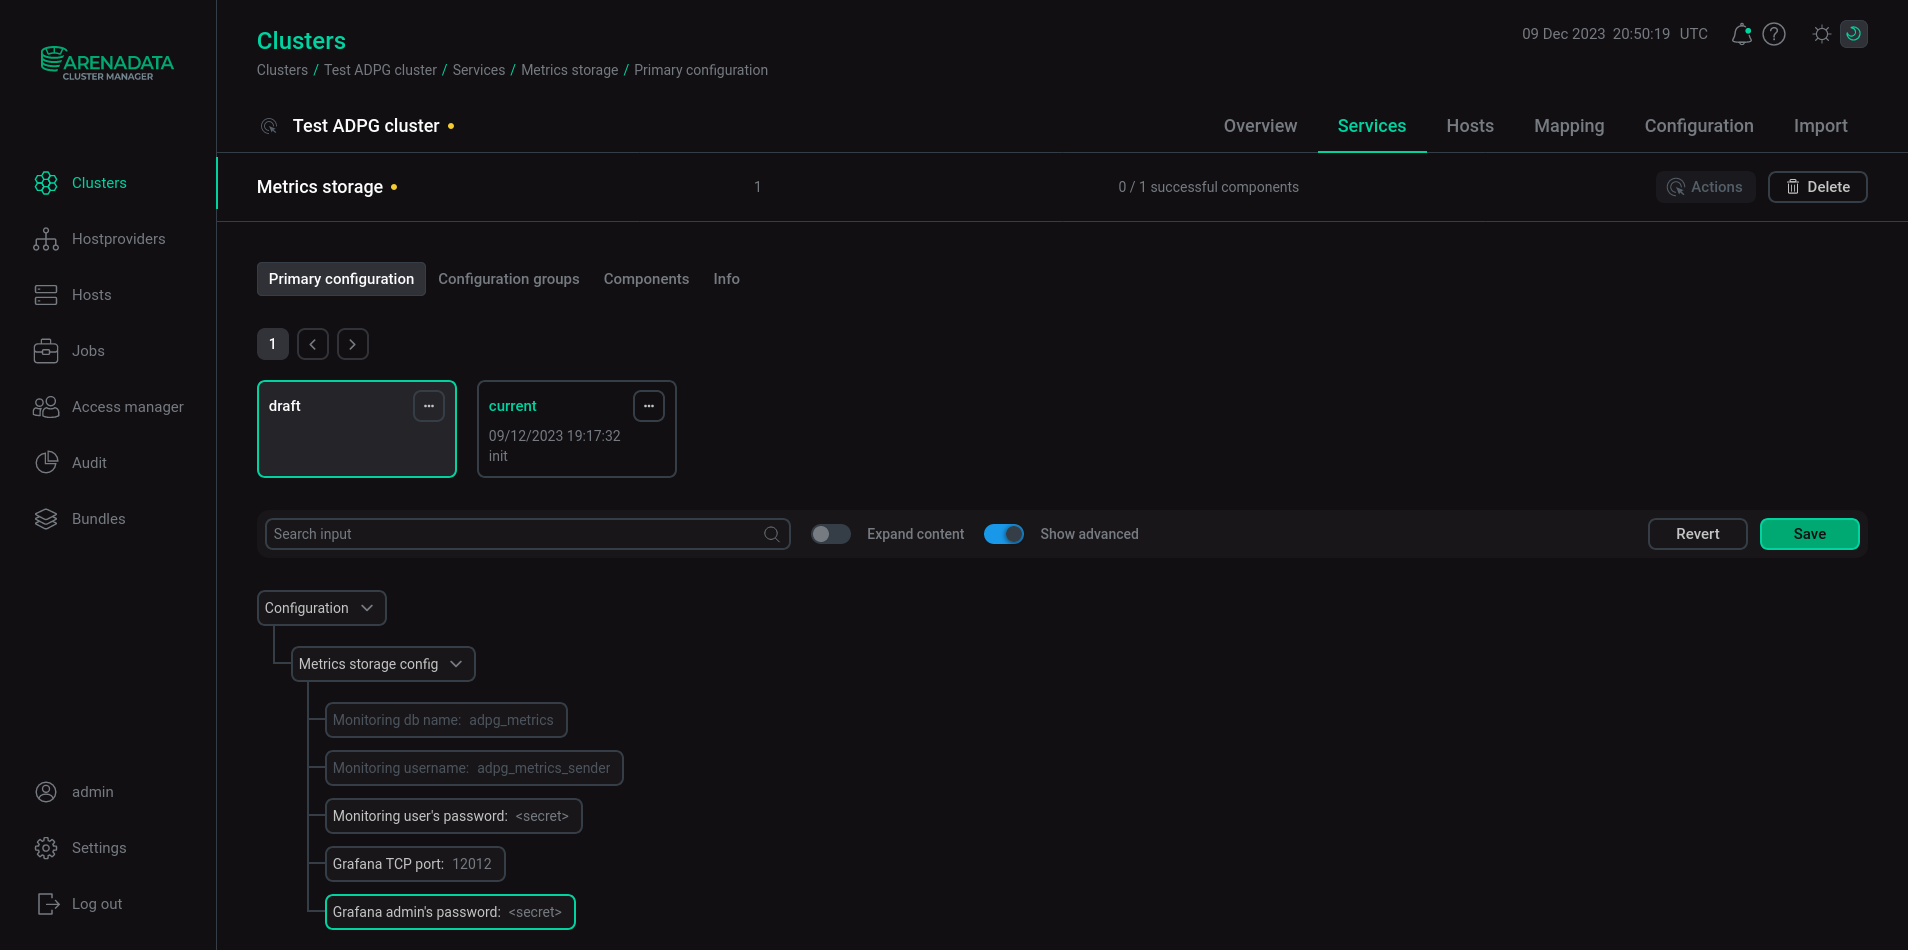
The Grafana admin’s password and Monitoring user’s password parameters are required.
After you specify all the necessary settings, click Save.
Step 4. Configure monitoring in an ADPG cluster
The monitoring system consists of the server and client parts. The server side (Metrics storage) can collect metrics from multiple ADPG clusters. A client ADPG cluster, in turn, can use a Metrics storage service from the following locations:
-
from the same ADPG cluster;
-
from an ADPG cluster managed by the same ADCM;
-
from an ADPG cluster managed by another ADCM.
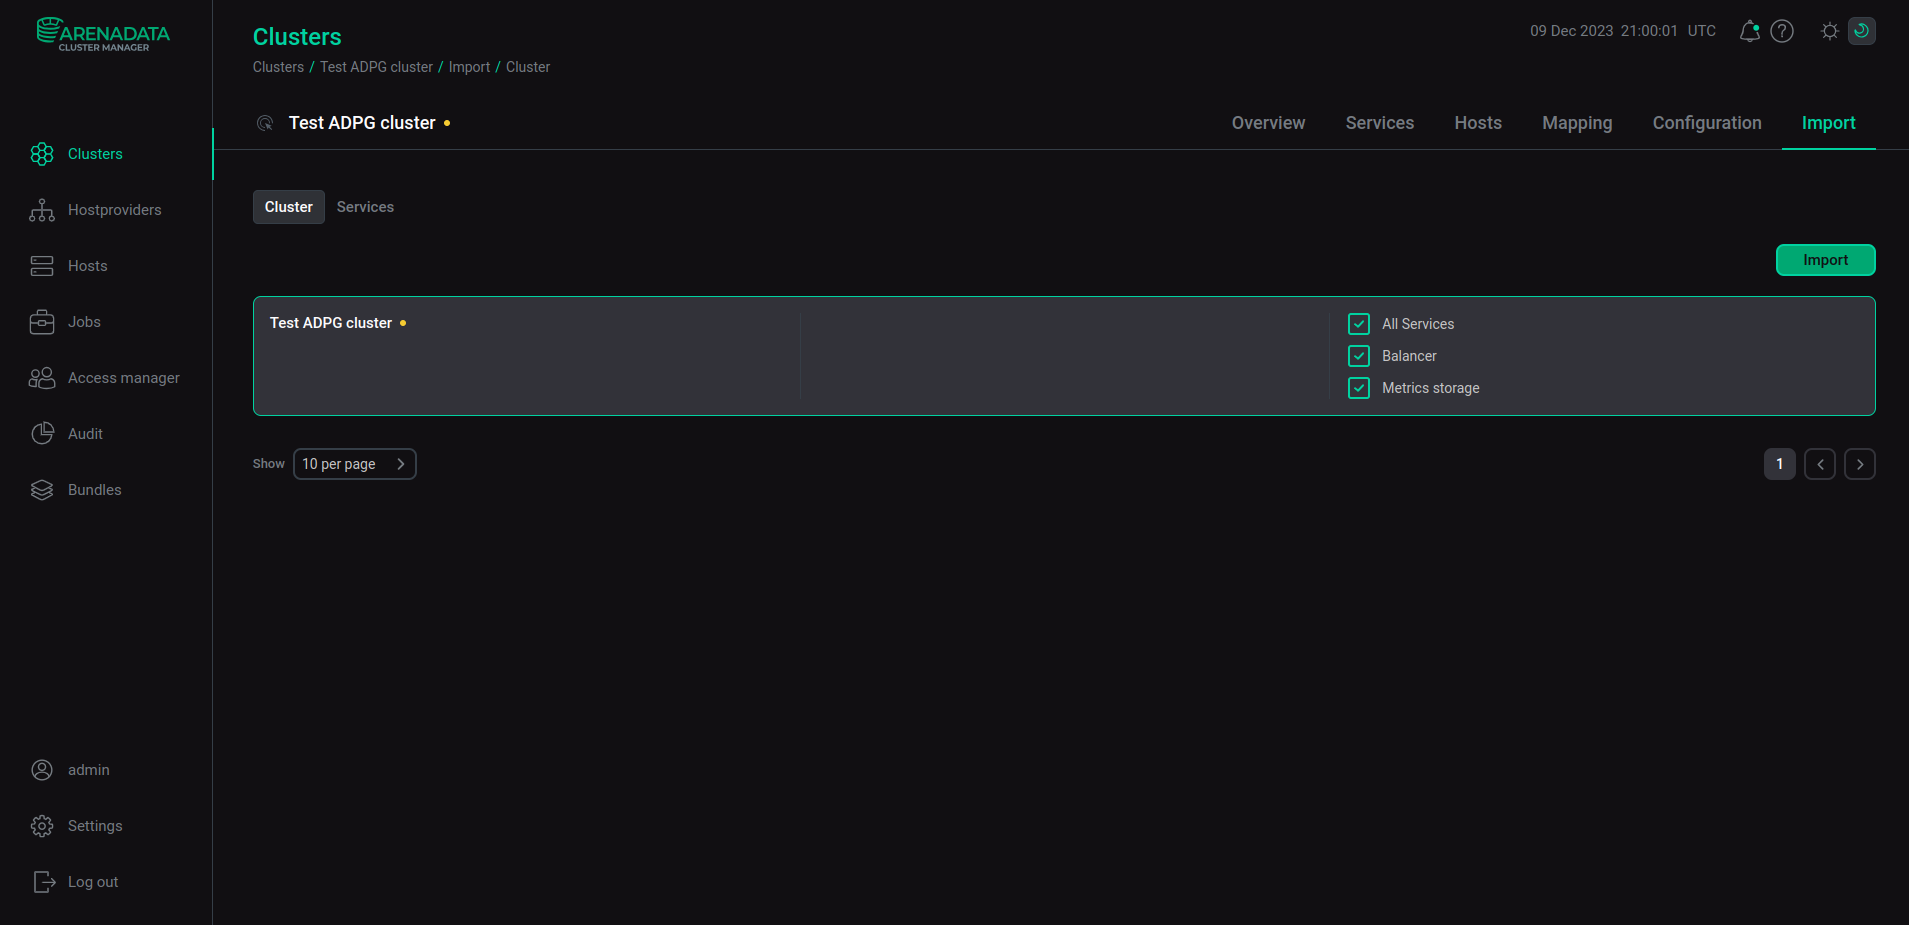
You can import the Metrics storage and Balancer settings from the same cluster or from another ADPG cluster managed by the same ADCM. To import settings, open the Import tab of the cluster page, select Metrics storage and Balancer, and click Import.
|
NOTE
You can import Metrics storage and Balancer settings only from an ADPG Enterprise Edition cluster.
|
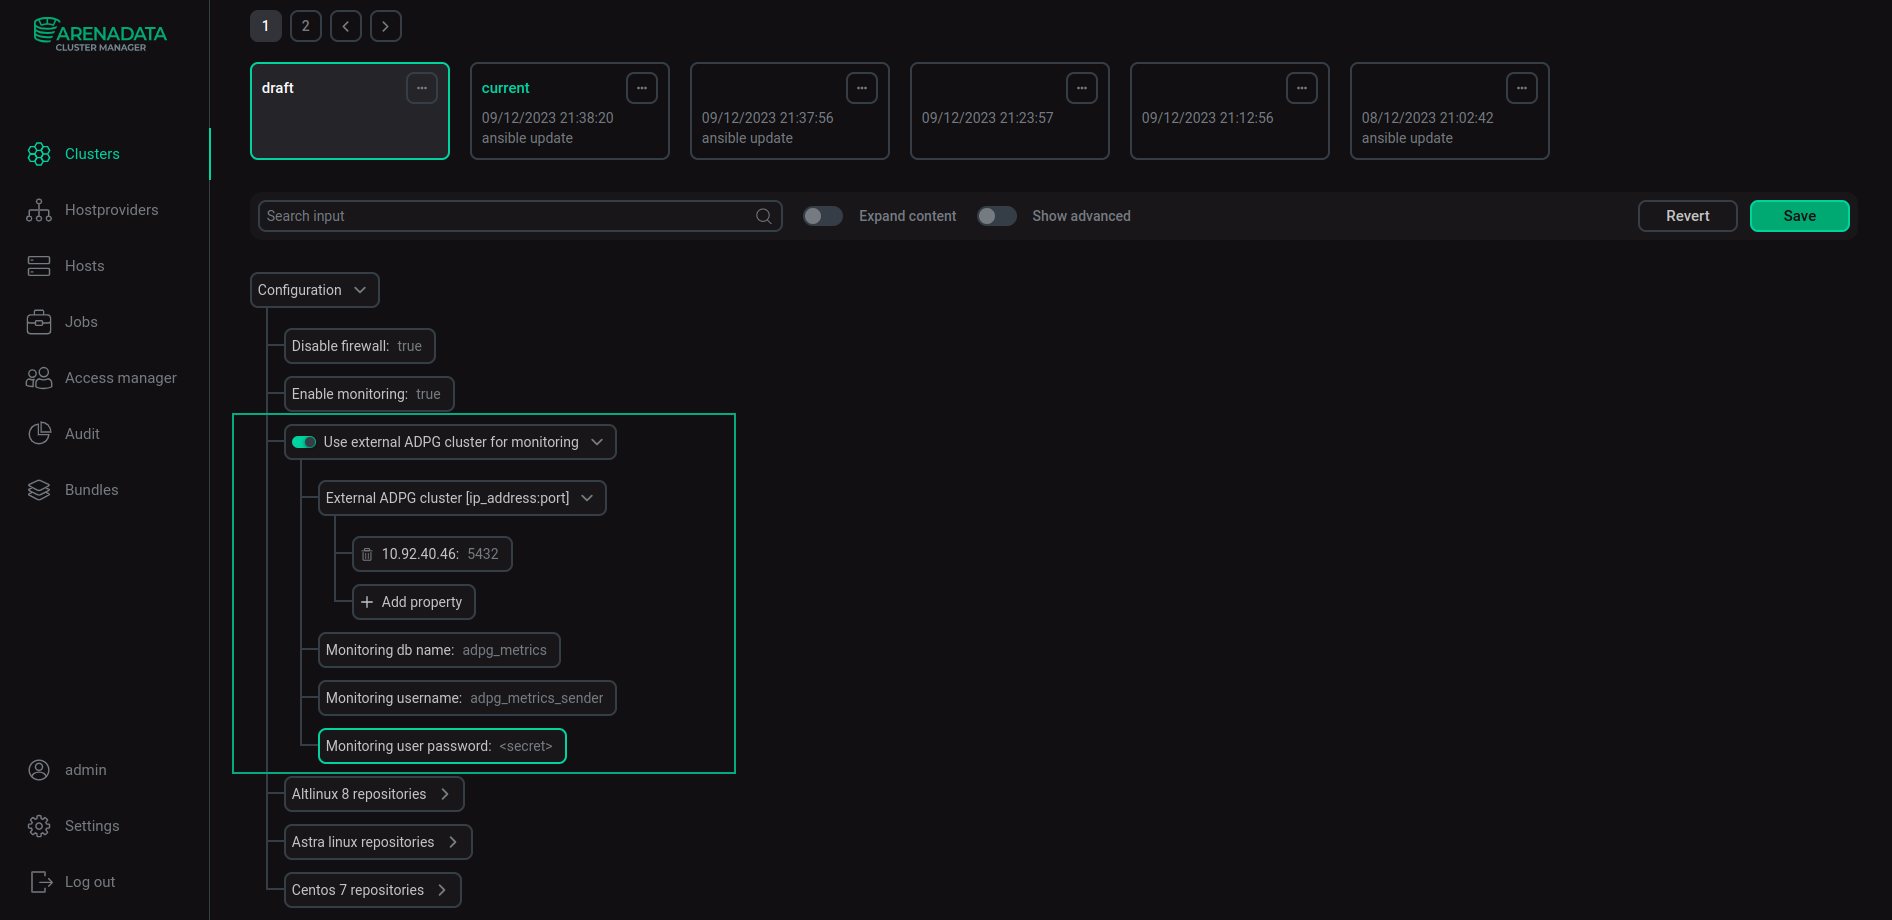
If you wish to use Metrics storage from an ADPG Community Edition cluster or from another ADCM, specify external ADPG cluster settings. To do this, open Configuration → Primary configuration tab of the cluster page. On this tab, switch on the Use external ADPG cluster for monitoring toggle button and specify other settings listed in the table below.
| Parameter | Description | Default value |
|---|---|---|
External ADPG cluster [ip_address:port] |
Specifies an IP address with a port of a host with the Balancer service that belongs to an external ADPG cluster with the Metrics storage service. If the external ADPG cluster includes multiple hosts with the Balancer service, specify IP addresses of all these hosts |
— |
Monitoring db name |
Defines a database that the Metrics storage service should use |
adpg_metrics |
Monitoring username |
Defines a username that is used to connect to the external ADPG monitoring cluster |
adpg_metrics_sender |
Monitoring user password |
Sets a password for the username, which is utilized to connect to the external ADPG monitoring cluster |
— |
After you specify settings, click Save.
Step 5. Install Metrics storage
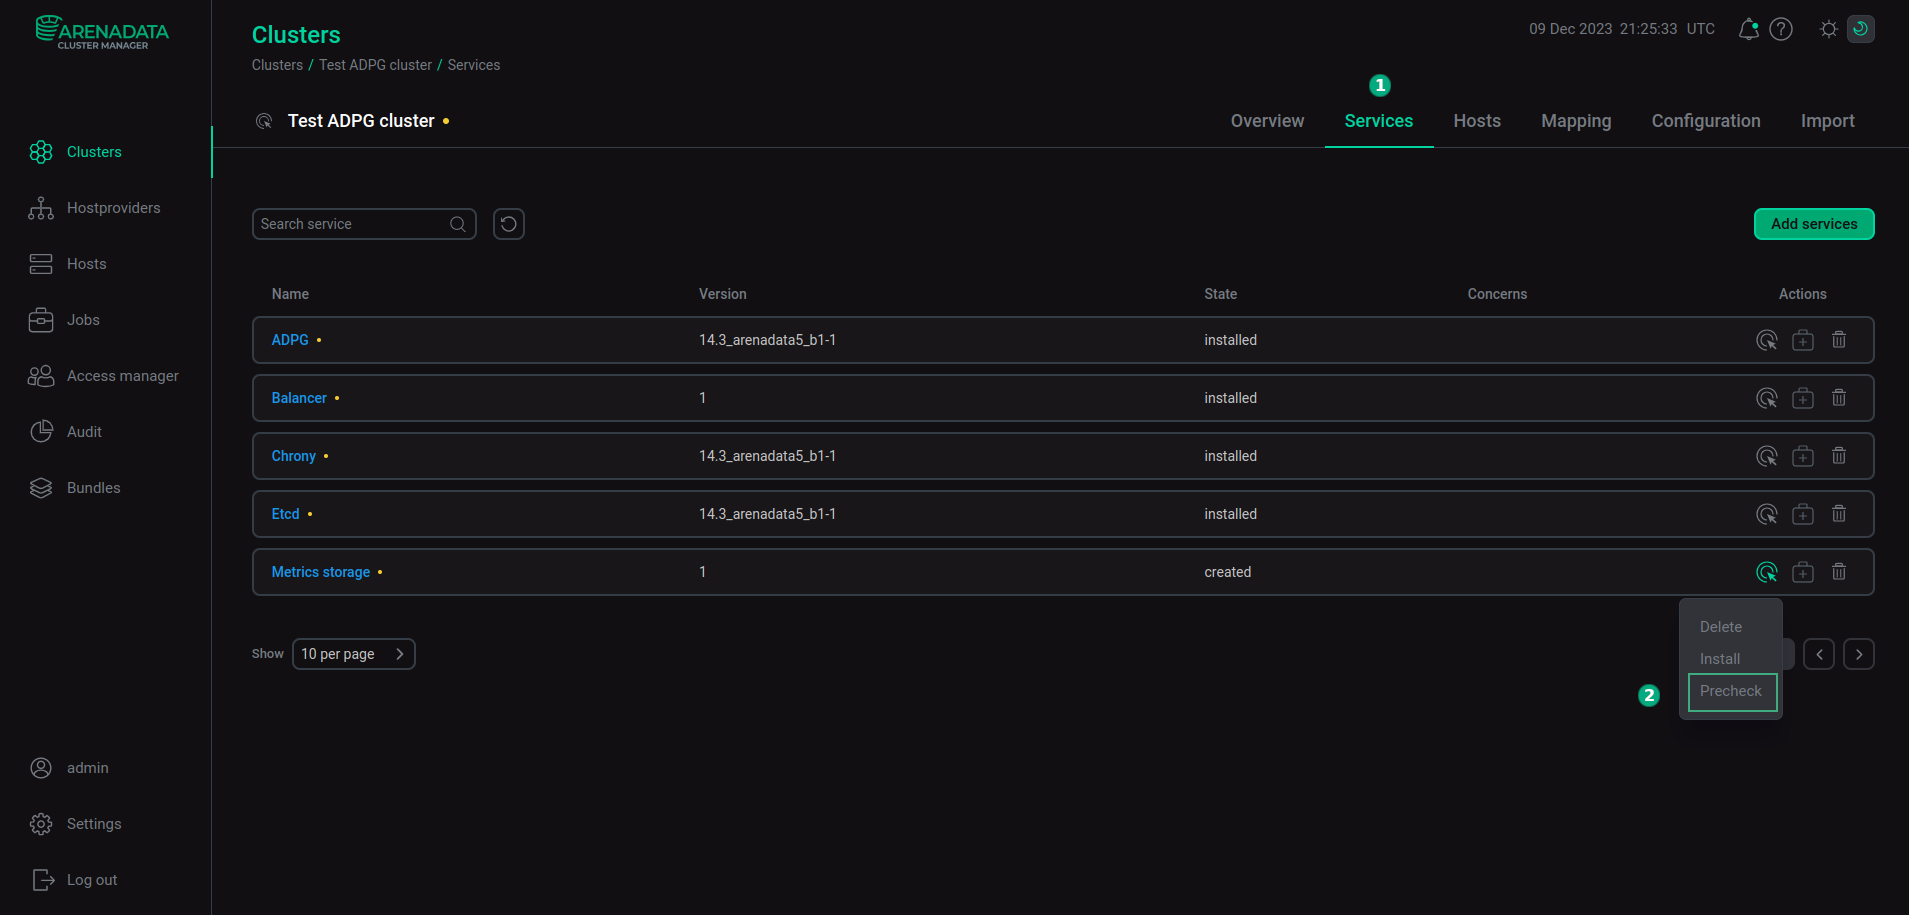
To install the Metrics storage monitoring service, go to the Services tab of the cluster page and execute the Precheck action of the Metrics storage service.
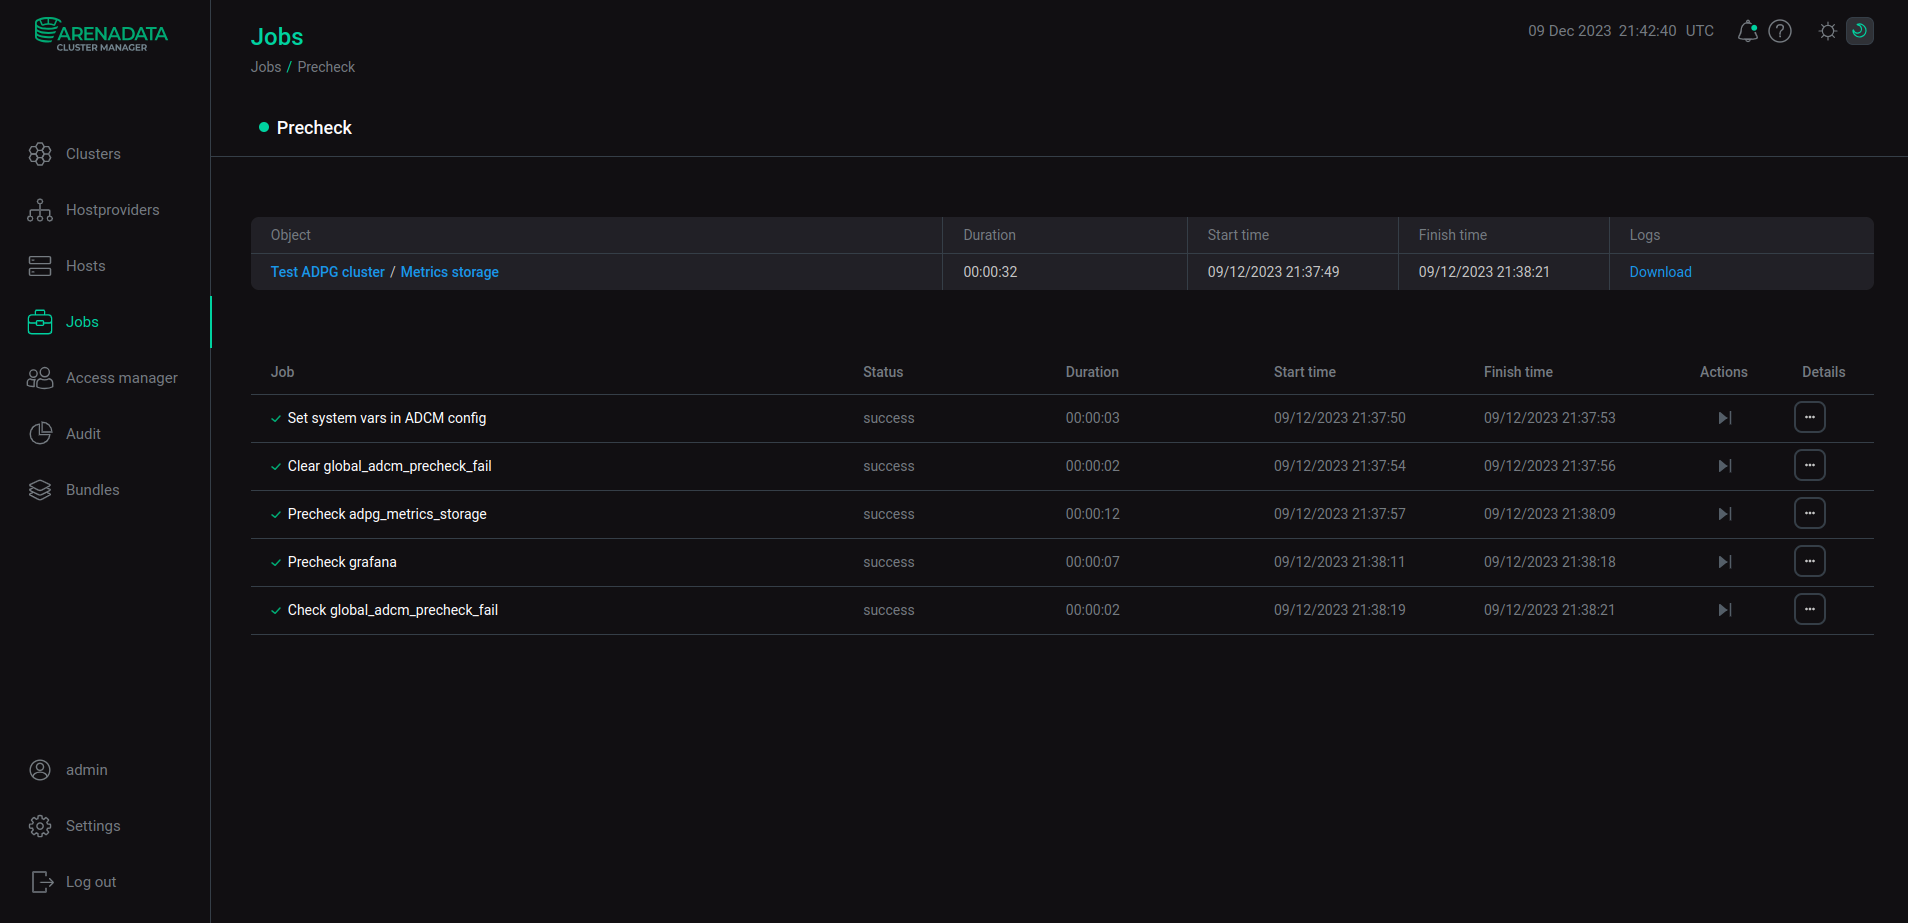
Check the result on the Jobs page.
If the Precheck action is successful, run the Install action of the Metrics storage service.
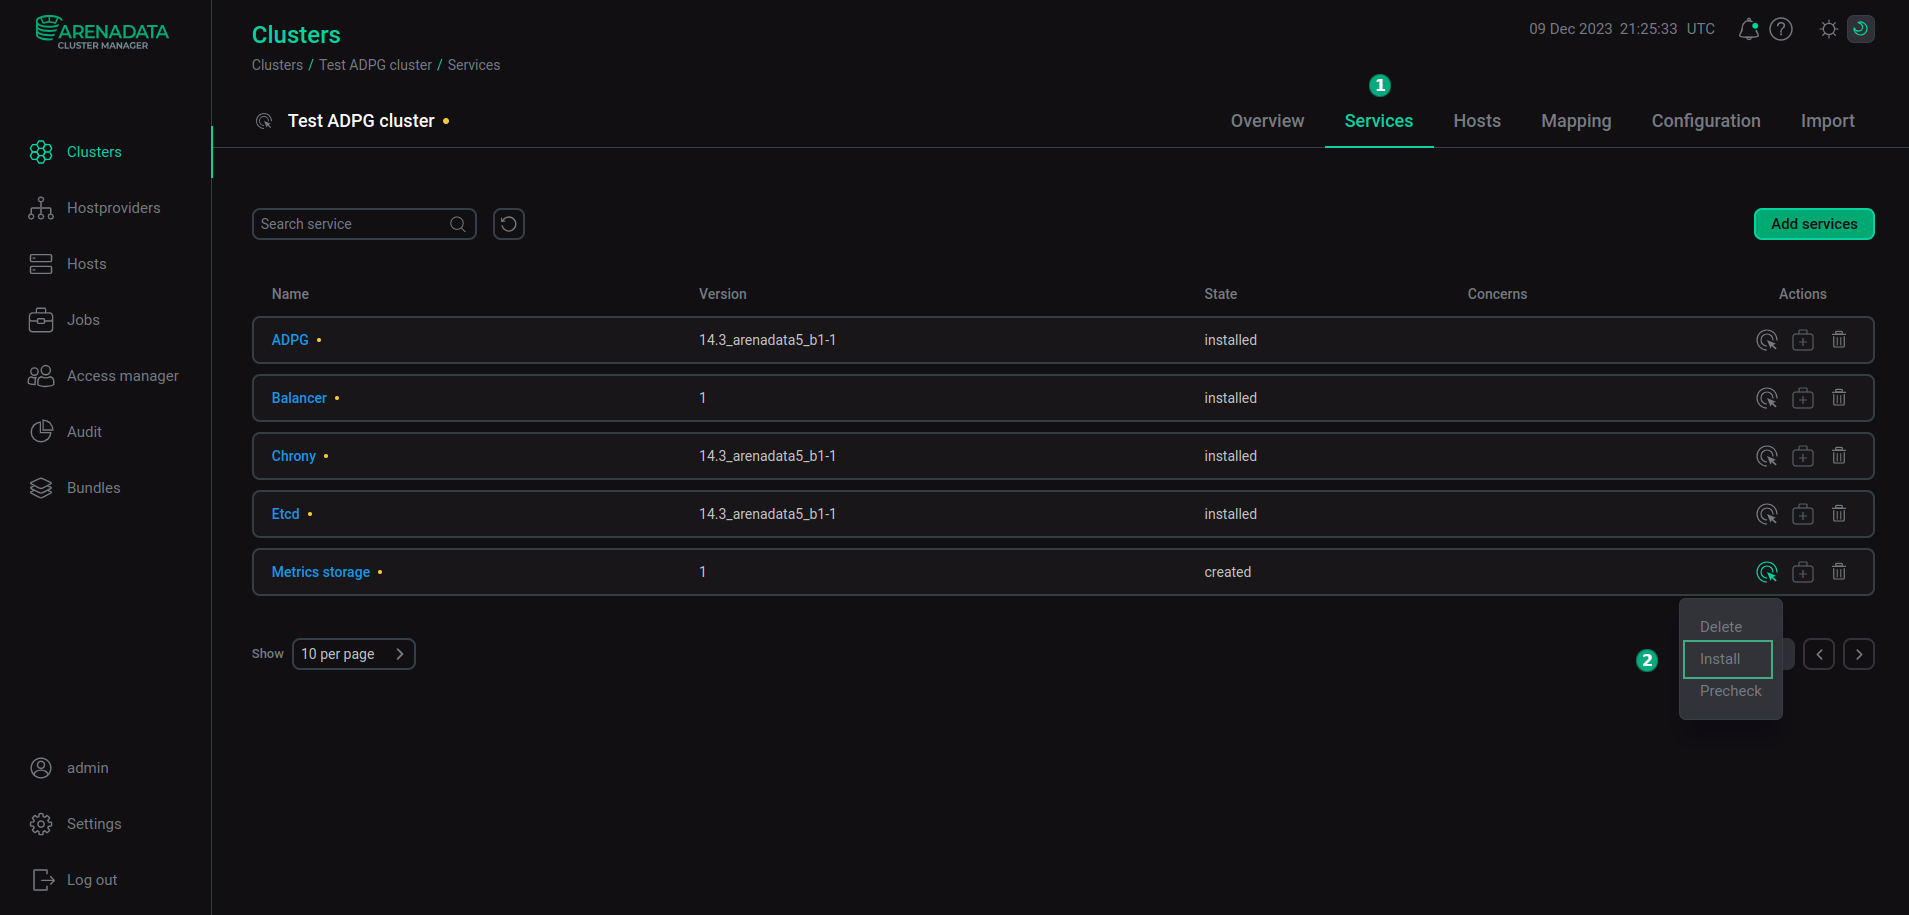
If errors occur, you can find information about them on the Jobs page. When the installation is successful, the service state displayed on the Services tab is changed from created to installed.
The Metrics storage service starts automatically after the installation. If you utilize the Grafana component, you can check the result in a browser. Enter the address of the host where Grafana is deployed and add the port number — the Grafana TCP port parameter (the default value is 12012). For example, http://10.92.6.91:12012. For login, use admin as a username, and the Grafana admin’s password parameter value as a password. You can find the Grafana parameters on the Configuration tab of the Metrics storage service.
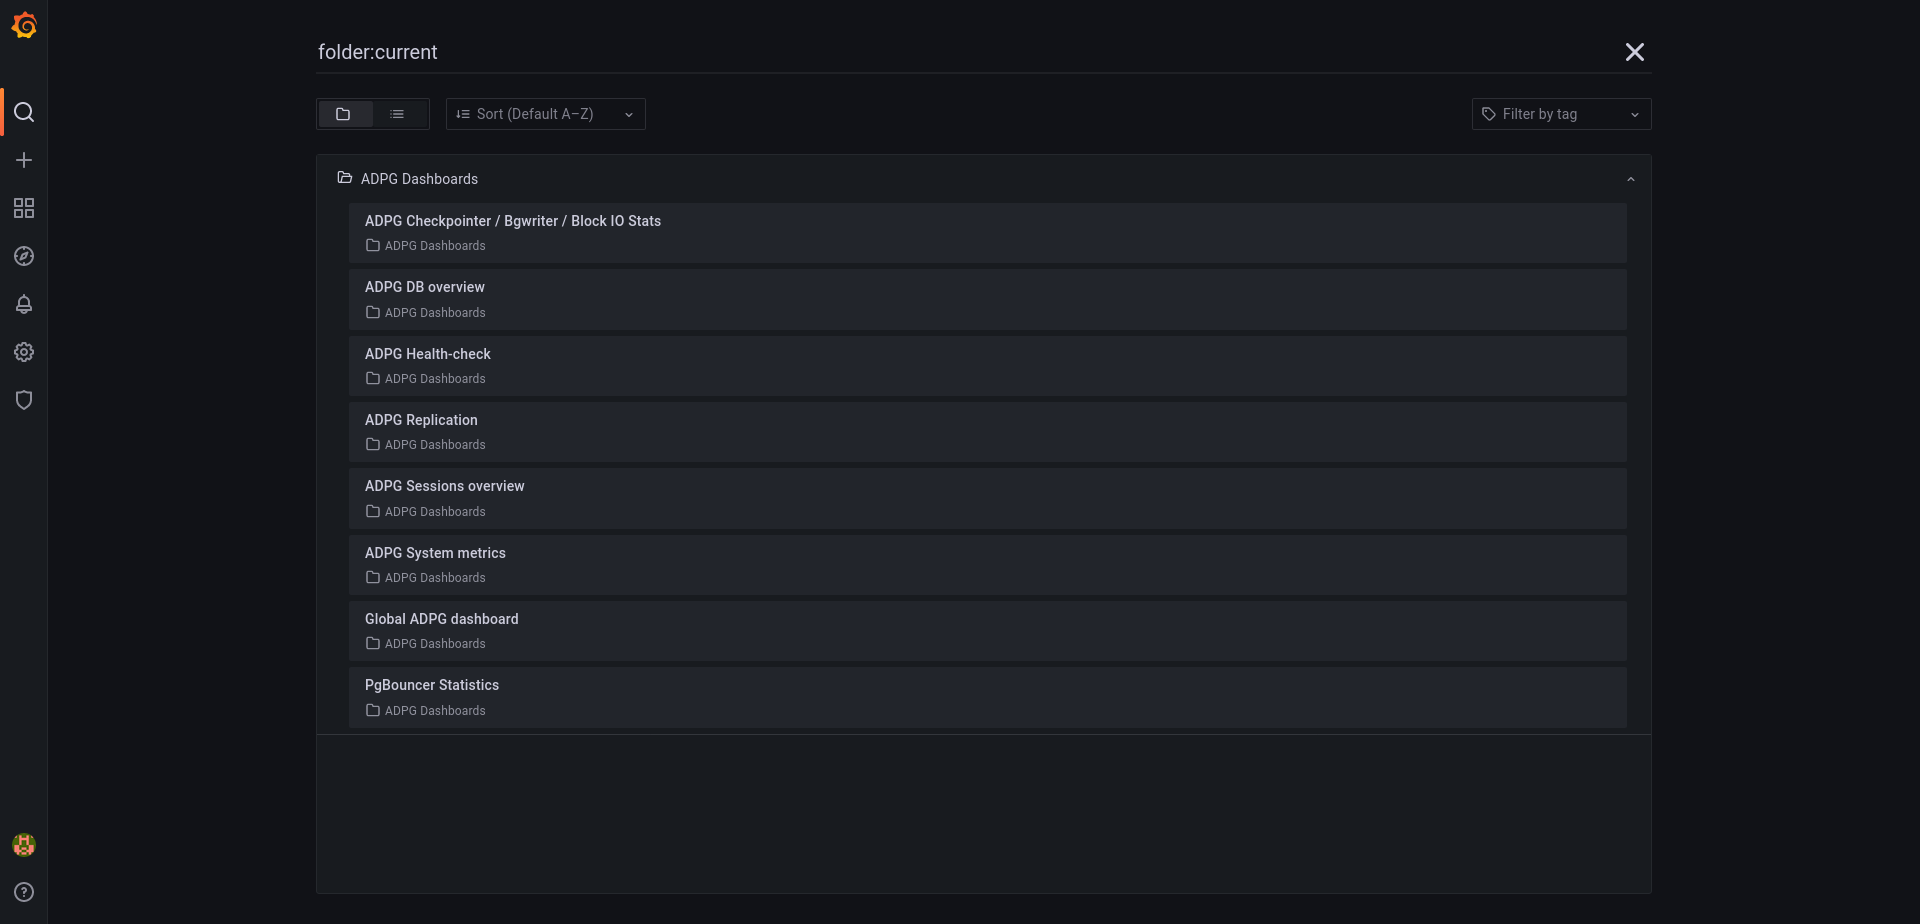
For information on available metrics, refer to ADPG monitoring metrics.